
Introduction
Clean vs dirty water is more than a visual contrast. In water management, the difference determines whether households stay healthy, utilities meet compliance, and ecosystems avoid harmful algal blooms. We’ll explain the difference between clean and unclean water in practical terms, as well as outline key indicators, and connect those indicators to the European Drinking Water Directive & EPA requirements. Along the way, we’ll also highlight the global health impact of unsafe water and what effective water treatment and Difference between clean and unclean water purification can do from source to tap.
What do we mean by clean vs dirty water?
Engineers and operators avoid subjective labels. Clean water meets microbiological and chemical targets that protect health. Dirty water fails one or more of these targets or shows early indicators, like high turbidity, that raise risk. That is the practical difference between clean and unclean water. Understanding this distinction has a real global health impact because contaminated supplies drive disease and economic losses, especially where the Population without access to clean water remains high.
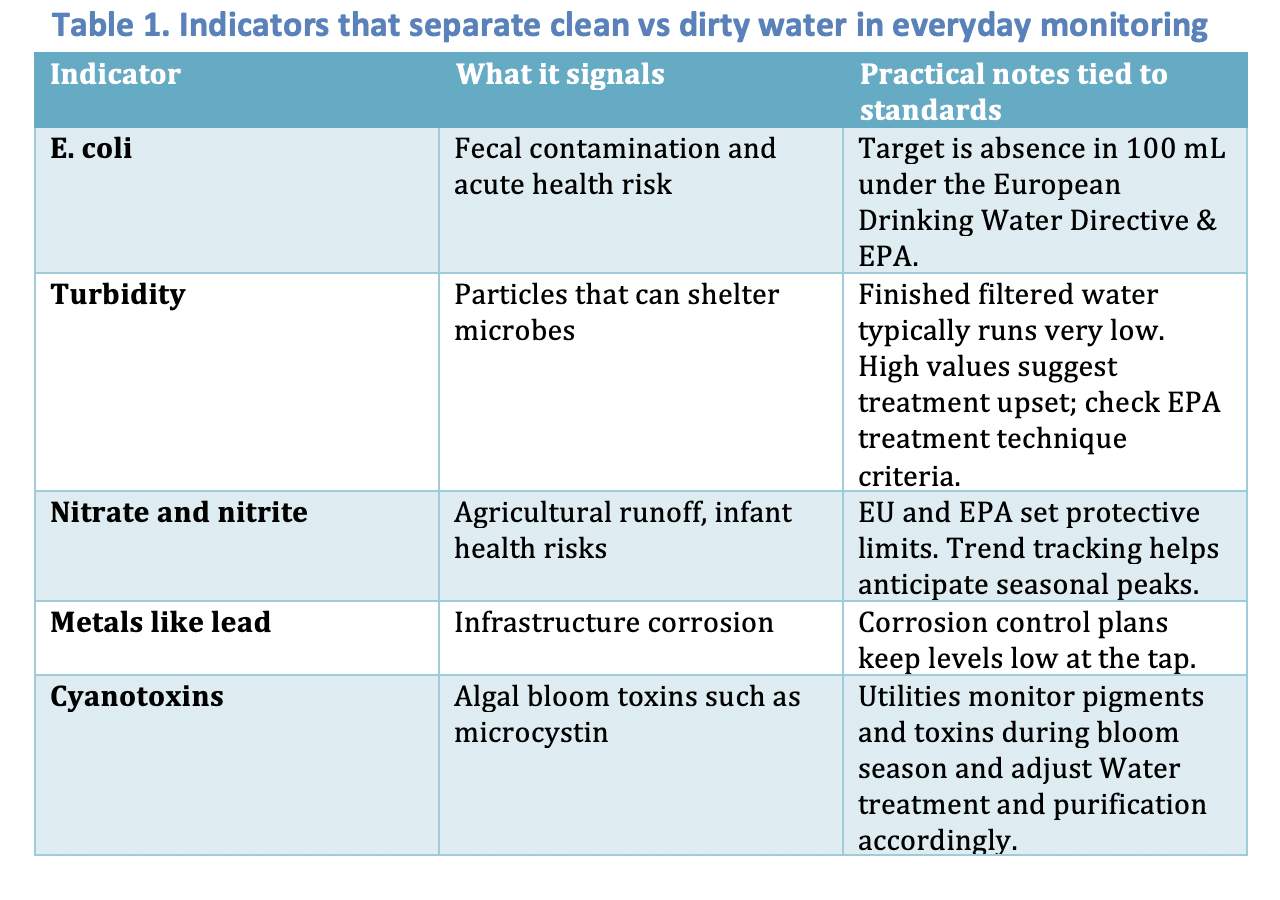
Three groups of indicators matter most in everyday operations:
- Microbial: E. coli or other pathogens signal immediate danger and trigger corrective actions.
- Physical: Turbidity, color, and temperature often rise before microbial detections, so operators use them as a fast early warning.
- Chemical: Nitrates, metals, pesticides, and disinfection byproducts inform both source water protection and treatment optimization.
Safety rules in practice: European Drinking Water Directive & EPA
The European Drinking Water Directive & EPA both define how water systems test, report, and respond to risk. The EU’s recast directive, Directive (EU) 2020/2184, sets parametric values and a risk based approach from catchment to consumer while the Commission provides a clear drinking water overview. In the United States, EPA’s Drinking Water Regulations and Contaminantsspecify maximum contaminant levels, treatment techniques, and monitoring schedules. Referencing both frameworks helps utilities that operate globally or benchmark across regions.
The global health impact of getting this wrong
Unsafe water causes diarrheal disease and other infections that still kill people every year. The global health impact shows up in child mortality, lost school days, and long term economic drag. Current estimates indicate a large Population without access to clean water, and many more with access that is unreliable or unsafe at the point of use. That is why smart Water treatment and purification and strong surveillance are necessary, not optional.
For global statistics, see the WHO/UNICEF Joint Monitoring Programme (JMP), which tracks safely managed drinking water and highlights inequality between and within countries.
- The Population without access to clean water remains substantial when you count households that lack safely managed services, so planning must consider affordability and maintenance.
- The Global health impact also includes chemical exposures that are less visible than outbreaks but still serious.
- Regulators update the European Drinking Water Directive and EPA programs as new risks emerge, so standards stay aligned with evidence.

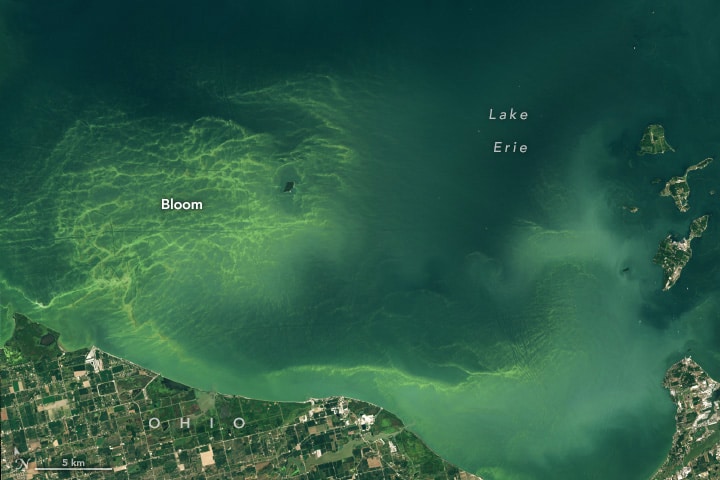
Photo 3: Aircraft view of a harmful algal bloom used by monitoring teams. Credit: NOAA
How to tell the difference between clean and unclean water in the field?
Operators make quick calls with screening tools. Portable meters measure turbidity, pH, and conductivity. Field kits test for residual disinfectant and sometimes nitrates. If turbidity spikes, the probability of microbial breakthrough rises, even before lab results arrive. That is why standard operating procedures link turbidity alarms to actions like filter backwashing or switching intakes. These tools do not replace lab confirmation, but they narrow response time, which is vital in the clean vs dirty water decision making that utilities face daily.
Standards that guide action, not just compliance
Standards might look theoretical, yet they map directly to actions in the plant. The European Drinking Water Directive & EPA both require proactive risk management. Examples:
- Source protection plans that address nutrient inflows.
- Monitoring programs that intensify during bloom season.
- Public communication protocols when thresholds are breached.
See the EPA’s ground water and surface water treatment rules for treatment technique requirements and the Commission’s risk-based approach summary for EU guidance. When teams treat standards as a living playbook, they improve Water treatment and purification outcomes and reduce the Population without access to clean water through more resilient service.
From nutrients to toxins: why source water matters
Nutrients like nitrogen and phosphorus fuel cyanobacteria. Warm, stagnant conditions and stable water columns help blooms form. As blooms develop, they can produce microcystin and other toxins that pass through treatment if unanticipated. Utilities therefore combine source surveillance with plant adjustments. This is the everyday, on the ground Difference between clean and unclean water: one system can handle seasonal stress without risk, the other struggles and drifts toward dirty water indicators.
For fundamentals on cyanobacteria and toxins, review the USGS cyanobacteria primer and NOAA’s HAB resources.
Treatment responses that work
Water treatment and purification follows a sequence that adapts to conditions:
- Coagulation and clarification to remove particles and a portion of organic precursors.
- Filtration to capture remaining fine solids and reduce turbidity. Operators verify performance with continuous turbidity meters.
- Disinfection to inactivate pathogens. Dose and contact time depend on temperature and organic load.
- Advanced steps as needed, like activated carbon for taste and odor episodes or cyanotoxins, or membrane processes for specific contaminants.
EPA provides contaminant specific guidance on treatment; see the list of regulated contaminants. For operations teams, the USGS turbidity overview explains why low turbidity correlates with robust microbial control.
These steps deliver clean vs dirty water outcomes every day. Plants that track pigments during bloom season, for example, can dose powder activated carbon before toxins break through the barrier train. And by treating the catchment as part of the system, managers reduce the Population without access to clean water because fewer communities suffer seasonal outages.
Ultrasound, monitoring, and prevention
Immediate control tools matter when blooms threaten drinking water intakes. LG Sonic’s low power ultrasound creates a sound layer that limits algae from reaching light rich surface waters, which reduces biomass and toxin risk without chemicals. Deployed with real time monitoring, ultrasound supports Water treatment and purification by stabilizing the source. It is one of several nature compatible measures that keeps reservoirs on the clean side of the clean vs dirty water divide. Learn more about the approach on LG Sonic’s technology page.
Frequently asked factual questions
Does clear water always mean safe water?
No. Many chemical hazards are invisible and taste free, which is why the European Drinking Water Directive & EPA rely on lab testing and risk management. For more information check out Directive (EU) 2020/2184 and EPA’s SDWA pages.
Why does turbidity matter so much?
Suspended particles shield microbes from disinfectants. Very low turbidity correlates with reliable pathogen removal. A quick primer is available from the USGS.
How do blooms affect plants?
Cyanobacterial cells clog filters, consume coagulant, and sometimes carry toxins that need specific handling. Plants maintain Water treatment and purification performance by adjusting coagulation and carbon dosing, while teams manage source conditions to avoid extreme events. For current science overviews, consult USGS and NOAA HAB resources.
Case note
Utilities that use ultrasound with real time data have reported shorter bloom seasons and fewer taste and odor complaints. Results vary by basin and climate, yet the mechanism remains consistent: keep algae from dominating the photic zone, track blooms with pigments, and adjust programs as species shift.
Clean vs dirty water in numbers
The Population without access to clean water is still large. Global monitoring data show that roughly one in four people are not connected to safely managed services, and many of them live in rural areas with intermittent supply. This persistent gap amplifies the Global health impact, particularly for children and the elderly. Bridging the gap requires investment in Water treatment and purification and in low energy source control that prevents blooms and sediment pulses from overwhelming plants.
For the latest access data and definitions, visit the WHO/UNICEF JMP.
Conclusion
Clean vs dirty water is not a philosophical debate. It is a measurable status guided by the European Drinking Water Directive & EPA and achieved through strong Water treatment and purification from source to tap. The Difference between clean and unclean water shows up in turbidity logs, microbial tests, and real world health outcomes. By pairing risk based standards with prevention tools like ultrasound, utilities protect communities, reduce the Population without access to clean water, and cut the Global health impact of unsafe supplies.