
Lake ecosystem water quality does not fail at random. It fails predictably — through a chain of physical and biological processes that begin weeks, sometimes months, before a bloom reaches the surface. For drinking water utilities and lake operators, that predictability is the opportunity. The same conditions that produce filter clogging, taste and odor complaints, and cyanotoxin exceedances at intake depth are detectable in advance — if the right parameters are being measured at the right depths. This guide explains how lake water quality dynamics work, which thresholds matter, and what a monitoring program must detect to act before operations are affected.
What Is a Lake Ecosystem and Why Does It Drive Water Quality?
A lake ecosystem is a system of organisms, water chemistry, and physical processes that interact to regulate water quality. It includes the water column, sediments, aquatic life, and the surrounding catchment — all cycling nutrients, oxygen, and energy through continuous feedback loops.
For water managers, the critical insight is this: lake ecosystems do not absorb disturbances passively — they amplify them. A nutrient pulse in spring does not stay contained. Instead, it feeds algal growth, which then consumes oxygen as it decays, which in turn releases more nutrients from sediments, which fuels the next bloom cycle.
Consequently, understanding where that chain begins — and where to break it — is the foundation of effective lake water quality management.
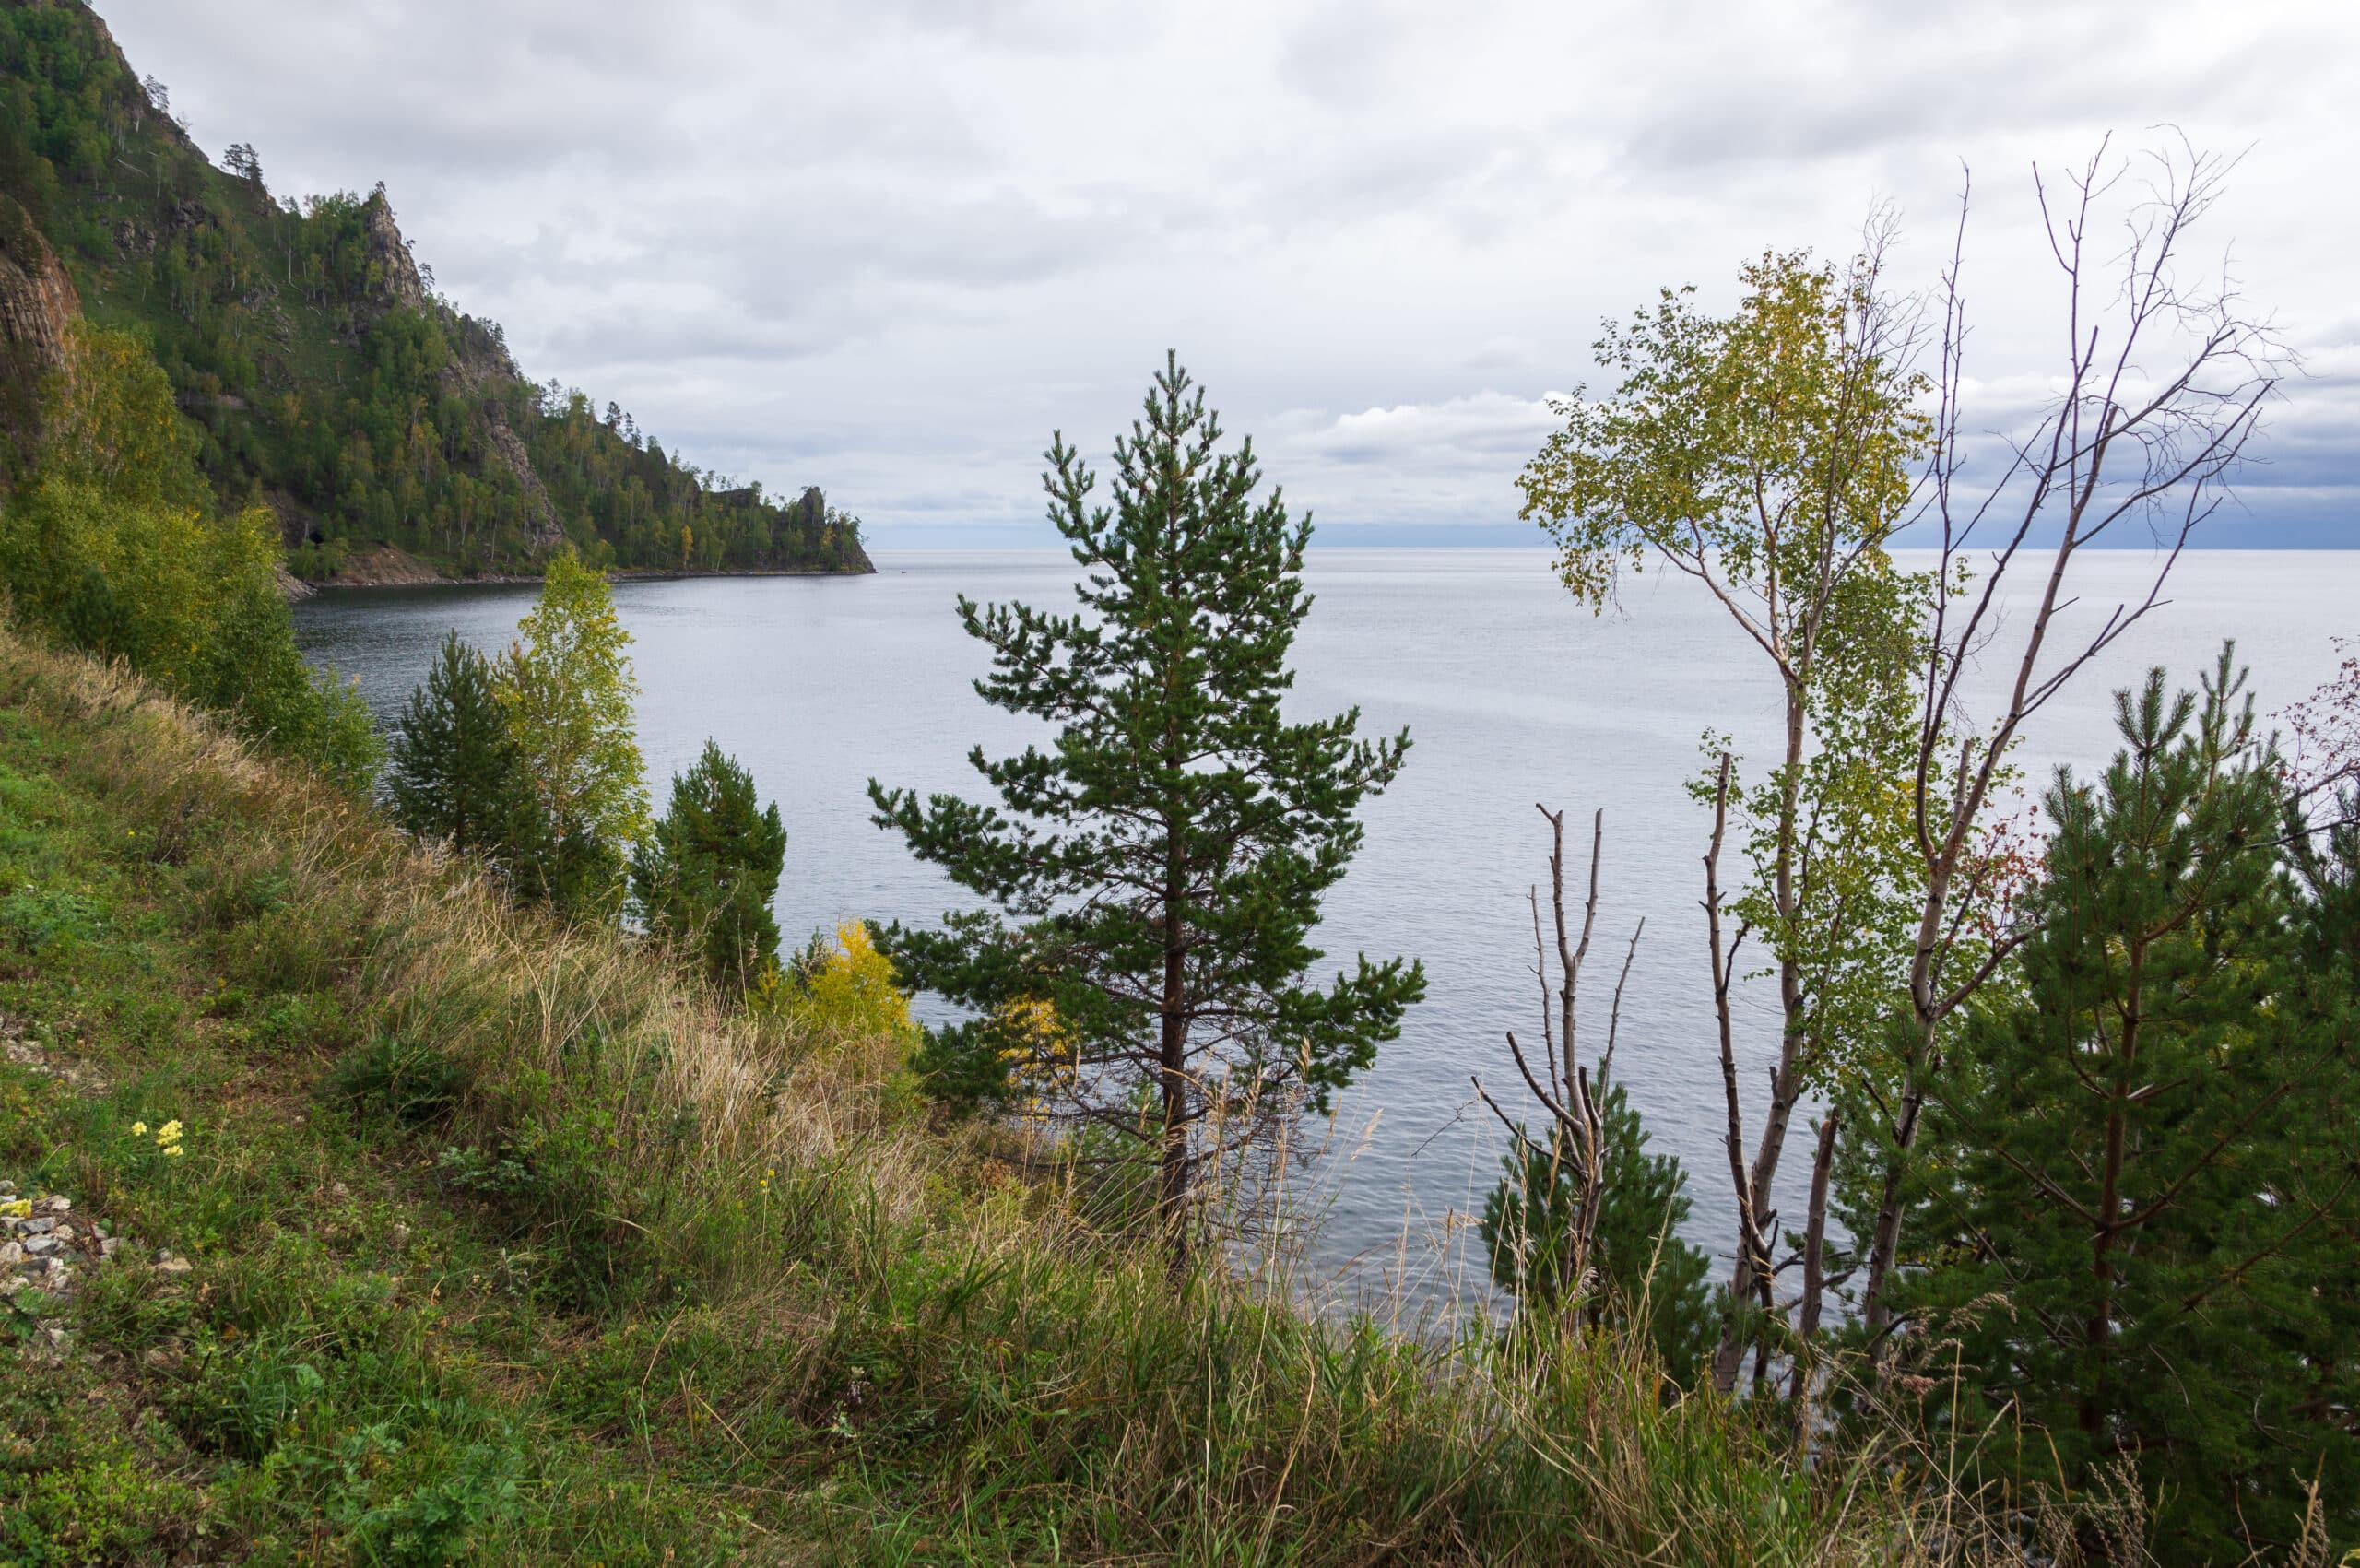
https://commons.wikimedia.org/wiki/File:Lake_Baikal,_Russia.jpg
Lake Ecosystem Structure: The Physical Framework Behind Water Quality
Lake ecosystem water quality decisions depend on understanding where in the water column critical processes occur. Structure determines where you monitor, what you measure, and when conditions become operationally critical.
Thermal stratification and why it controls water quality
In temperate lakes, summer heating creates three distinct layers that resist vertical mixing:
- Epilimnion: Warm surface layer (typically 18–25°C). Wind-mixed and oxygen-replenished. This is where algal blooms concentrate and where most surface monitoring occurs.
- Metalimnion (thermocline): Transition zone where temperature drops 1–3°C per meter. It acts as a density barrier. Nutrients accumulate here as sinking organic matter slows.
- Hypolimnion: Cold bottom layer, isolated from surface oxygen inputs. As organic matter decomposes here, dissolved oxygen depletes — often to levels that trigger phosphorus release from sediments.
The management implication: A surface sensor showing 9 mg/L dissolved oxygen tells you nothing about conditions at 8 meters. The hypolimnion is where the critical processes occur, yet it is invisible to surface-only monitoring programs.
Habitat zones and what they signal for lake managers
- Littoral zone (nearshore, light-penetrating): Where aquatic macrophytes establish. Dense, healthy plant beds stabilize sediments and compete with algae for nutrients. Their presence indicates a lake in a relatively stable, clear-water state.
- Pelagic zone (open water): Where phytoplankton dominate primary production and where harmful algal blooms concentrate during stratification.
- Benthic zone (sediment layer): Where phosphorus accumulates and releases. Consequently, the condition of this zone determines how long a lake continues producing blooms after external nutrient inputs have been reduced.
Eutrophication: The Root Cause of Most Lake Water Quality Failures
Eutrophication is the enrichment of a water body with nutrients — primarily phosphorus in freshwater systems — that drives algal growth, oxygen depletion, and long-term lake water quality decline.
It is, therefore, the root cause behind most harmful algal bloom events, filter clogging in drinking water treatment, and recreational closures.
How external loading starts the water quality decline cycle
Phosphorus enters lakes through agricultural runoff, stormwater, failing wastewater infrastructure, and catchment erosion.
In freshwater systems, phosphorus is typically the limiting nutrient. As a result, even small increases in bioavailable phosphorus produce disproportionate algal responses.
Operational implication: Catchment changes — new development, increased fertilizer application, altered drainage — can shift a lake’s nutrient baseline within a single season. Moreover, utilities drawing from lakes in active catchments should track external loading trends, not just in-lake conditions.
Why internal loading prolongs the problem
This is the mechanism most lake managers underestimate.
Phosphorus accumulates in lake sediments over years of loading. When bottom-water dissolved oxygen drops below 2 mg/L, iron-phosphorus compounds dissolve and release stored phosphorus back into the water column.
As a result, internal phosphorus release accelerates within days — increasing bloom risk even without any new external inputs.
Furthermore, a lake can sustain harmful bloom seasons for 5–10 years after external nutrients have been controlled, driven entirely by legacy phosphorus in sediments.
This is the most common reason lake restoration programs produce disappointing results. External load reduction is necessary, but it is not sufficient on its own.
Eutrophication at a glance
- Trigger: Phosphorus + warm temperature + stable stratification
- Mechanism: Algal growth → oxygen depletion → sediment phosphorus release → more algal growth
- Key risk threshold: DO below 2 mg/L in the hypolimnion
- Timeline: Internal loading can sustain blooms 5–10 years after external inputs are controlled
For a detailed framework on diagnosing and resolving lake algae problems, see LG Sonic’s guide to effective algae control.
The EPA’s nutrient criteria guidance for lakes and reservoirs further explains why sustained nutrient management is essential for protecting aquatic life and drinking water sources.
Harmful Algal Blooms: Causes, Risk Signals, and Operational Impact
A harmful algal bloom (HAB) occurs when cyanobacteria grow rapidly enough to form dense surface accumulations. These accumulations disrupt aquatic life, threaten public health, and impact water treatment operations directly.
What drives bloom formation in lake ecosystems
Bloom development requires three conditions to align simultaneously:
- Available phosphorus — from either external loading or internal sediment release
- Warm, stable water temperature — cyanobacteria thrive above 20°C and outcompete other algae under stable stratification
- Sufficient light — cyanobacteria regulate their own buoyancy to position at optimal light depths
When all three align, bloom formation can accelerate from first detection to operational impact in 7–14 days.
Operational impacts for water utilities
- Cyanotoxins at intake depth can exceed WHO guideline values (1 µg/L for microcystin-LR) before surface blooms are visually apparent
- Algal biomass increases filter loading, reducing filter run times and increasing backwash frequency
- Taste and odor compounds (geosmin, 2-MIB) become detectable at concentrations as low as 5–10 ng/L — well below health thresholds but directly affecting consumer perception
- In City of Archie, Missori, U.S. drinking water application using LG Sonic ultrasound, filter runtime increased by approximately 300% after bloom pressure on treatment intake was reduced
Dissolved Oxygen: The Core Threshold Indicator for Lake Water Quality
Dissolved oxygen (DO) is the most diagnostically useful parameter in lake ecosystem water quality monitoring. It simultaneously reflects biological activity, decomposition rate, and stratification status — making it the primary early warning indicator for both bloom development and treatment risk.
USGS identifies dissolved oxygen as a fundamental indicator of aquatic ecosystem health, directly reflecting the balance between life and decay in the water column.
Key DO thresholds every lake manager should know
Threshold | Consequence |
DO < 5 mg/L | Coldwater fish excluded from deep water; thermal stress increases |
DO < 3 mg/L | Most invertebrates begin leaving the zone; food web compression |
DO < 2 mg/L | Iron-phosphorus compounds dissolve; internal phosphorus loading begins |
DO < 0.5 mg/L | Anoxic conditions; hydrogen sulfide production; taste and odor risk at intake |
Dissolved oxygen quick reference
- < 5 mg/L → fish stress begins; coldwater species excluded from deep water
- < 3 mg/L → food web disruption; invertebrates begin leaving the zone
- < 2 mg/L → phosphorus release from sediments; internal loading begins
- < 0.5 mg/L → anoxic zone; taste and odor compounds; intake risk
Why depth-resolved DO monitoring is non-negotiable
A surface DO reading in summer stratification is frequently 8–10 mg/L — well within acceptable range. Meanwhile, the hypolimnion of the same lake may sit at 0.5 mg/L, actively releasing phosphorus that will fuel the next bloom event.
In short: if your monitoring program relies on surface or single-depth sensors, you are not measuring the processes that drive your treatment challenges. You are measuring their symptom — after it has already reached the surface.
Lake Ecosystem Monitoring: Parameters That Drive Water Quality Decisions
Effective lake ecosystem water quality monitoring is not about collecting data. It is about detecting early warning signals before they become operational incidents.
Parameters that matter for lake water quality management
Chlorophyll-a: Proxy for total algal biomass. A rising trend over 2–3 weeks before a bloom is the primary leading indicator available to water managers. → Rising values over consecutive readings signal increasing bloom risk.
Phycocyanin: Fluorescent pigment specific to cyanobacteria. It tracks HAB-forming species independently of total biomass. → When phycocyanin rises relative to chlorophyll-a, cyanobacteria are becoming dominant. Intervention should therefore be considered at this stage to prevent full bloom formation.
Full-column dissolved oxygen profile: The single most important dataset for lake condition assessment. Collect at minimum bi-weekly during stratified periods.
Continuous monitoring systems — often integrated with real-time algae control technologies — provide the operational standard for utilities with bloom-sensitive intakes. A single grab sample cannot capture the day-to-day shifts that precede bloom development.
Temperature profile: Defines thermocline depth and mixing potential. A shallowing thermocline in late summer signals reduced mixing capacity and rising bloom risk — particularly for autumn turnover events that redistribute hypolimnetic nutrients.
Turbidity: Indicates sediment resuspension and light availability. Storm events that spike turbidity can reset bloom dynamics by redistributing nutrients throughout the water column within 24–48 hours.
Why spatial coverage matters for accurate lake water quality data
One monitoring station does not represent a lake. Shallow bays stratify and de-stratify independently from the main basin. Additionally, cyanobacteria can concentrate at specific depths and locations hours before a visible surface bloom develops.
For drinking water utilities: Intake depth monitoring is the minimum requirement. Algal toxin concentrations at intake depth frequently differ substantially from surface measurements — sometimes in opposite directions.
Early warning signals: signal → action → outcome
Phycocyanin rising steadily over 5–7 days → Signal: Cyanobacteria becoming dominant in the water column → Action: Increase monitoring frequency; consider deploying preventive control → Outcome: Prevent surface bloom formation before operational impact
Hypolimnetic DO dropping below 2 mg/L → Signal: Internal phosphorus loading beginning; sediment release imminent → Action: Increase vertical profiling frequency; alert treatment operations → Outcome: Avoid nutrient pulse that would fuel the next bloom cycle
Chlorophyll-a exceeding 10 µg/L at intake depth → Signal: Bloom biomass at operationally significant levels → Action: Activate treatment protocol adjustments; increase backwash frequency → Outcome: Maintain filter performance and protect treated water quality
Thermocline depth shallowing week-over-week → Signal: Lake mixing capacity reducing; bloom conditions intensifying → Action: Prepare for elevated HAB risk in the coming 2–4 weeks → Outcome: Earlier intervention at lower treatment cost
Elevated water temperature (>20°C) combined with low wind speed → Signal: Bloom preconditions aligning → Action: Begin daily monitoring of phycocyanin and chlorophyll-a → Outcome: Maximum lead time for intervention decisions
For best practices on proactive algae prevention through monitoring-led intervention, see LG Sonic’s algae prevention guide.
Monitoring parameters quick reference
- Chlorophyll-a → total algal biomass; primary bloom leading indicator
- Phycocyanin → cyanobacteria-specific; bloom type risk indicator
- DO full-column profile → internal loading risk and fish habitat status
- Temperature profile → stratification structure and mixing capacity
- Turbidity → sediment resuspension and nutrient redistribution risk
How Long Does Lake Water Quality Recovery Take?
Recovery from eutrophication proceeds in stages. Understanding the timeline prevents over-optimism — expecting year-one results from catchment management — and equally prevents under-investment before internal loading has cleared.
The internal loading lag: why lake water quality results take longer than expected
Recent research published in Environmental Science & Technology confirmed that sustained nitrogen reduction reversed eutrophication trends in shallow lakes — but only on a five-year timescale, and only with consistent reductions. Partial or temporary nutrient controls do not overcome sediment phosphorus stores. (ACS, DOI: 10.1021/acs.est.5c05392)
Operational translation: If your lake has 10–20 years of phosphorus accumulation in sediments, external nutrient control alone will not produce visible bloom reduction in year one or two. A combined approach — external load reduction plus targeted internal intervention — compresses the timeline significantly.
Lake water quality recovery stages
Timeframe | What changes |
Weeks to months | Bloom intensity decreases after storm mixing events; short-lived clarity improvements |
1–3 years | Chlorophyll-a and bloom duration begin to decline if both external and internal loading are addressed; macrophyte recovery starts in littoral zone |
3–7 years | Improved hypolimnetic oxygen during stratification; food web recovery; shorter bloom seasons |
7–15 years | Legacy sediment phosphorus declines to non-problematic levels; full benthic community recovery |
For lake managers developing multi-year restoration programs, comprehensive frameworks are available through LG Sonic’s lake management resources.
Integrated Monitoring and Algae Control: Closing the Gap Between Signal and Action
Long-term nutrient management is the foundation of lake restoration. However, for lakes under active bloom pressure — drinking water reservoirs, recreational lakes, industrial cooling water bodies — waiting years for nutrient reduction to take effect is not operationally viable.
The gap between monitoring a problem and preventing a problem comes down to what happens between a data signal and a management response.
When continuous monitoring detects early warning signals — rising phycocyanin, declining hypolimnetic DO, increasing chlorophyll-a at intake depth — conditions can be stabilized before treatment operations are affected. As a result, real-time data shifts the response from reactive treatment to proactive intervention.
LG Sonic’s ultrasound technology targets cyanobacteria in the photic zone using low-power acoustic frequencies that disrupt buoyancy regulation — without chemicals and without harm to fish, zooplankton, or other non-target organisms. Furthermore, the MPC-Buoy monitoring system provides continuous multi-parameter profiling that feeds directly into bloom risk assessment and intervention timing.
In one U.S. drinking water application, filter runtime increased by approximately 300% after bloom pressure on the treatment intake was reduced. By combining continuous monitoring with targeted algae control, lake managers can therefore reduce bloom intensity while protecting both raw water quality and downstream treatment costs.
Managing bloom pressure on your reservoir or drinking water intake?
LG Sonic’s MPC-Buoy combines continuous multi-parameter monitoring with targeted ultrasound algae control — giving operators early warning and active intervention in one system.
→ See how City of Archie reduced filter loading by 300%
Explore the MPC-Buoy system
→ Request a consultation
FAQ
What is lake ecosystem water quality? Lake ecosystem water quality refers to the physical, chemical, and biological conditions in a lake that determine its suitability for drinking water, aquatic life, and recreation. Nutrient levels, dissolved oxygen, temperature stratification, and the biological community shape it, all interacting continuously.
What causes harmful algal blooms in lakes? Harmful algal blooms are caused by elevated phosphorus and nitrogen levels, warm water temperatures above 20°C, and stable stratification that allows cyanobacteria to regulate their depth. Moreover, internal phosphorus loading from low-oxygen sediments can sustain blooms even after external nutrient inputs are controlled.
At what dissolved oxygen level should lake managers intervene? The critical threshold is DO below 2 mg/L in the hypolimnion, which triggers internal phosphorus release within days. Fish habitat stress begins at DO below 5 mg/L. Utilities with deep intakes should therefore treat any sustained decline below 3 mg/L as an early warning condition.
Why does a lake continue producing algal blooms after nutrients are reduced? Because phosphorus stored in lake sediments continues releasing into the water column when bottom-water oxygen drops — a process called internal loading. This legacy phosphorus can sustain bloom conditions for 5–10 years after managers eliminate external nutrient inputs.
What parameters should a lake water quality monitoring program measure? At minimum: chlorophyll-a, phycocyanin, full-column dissolved oxygen profiles, temperature profiles, and turbidity. For drinking water utilities, all parameters should additionally be measured at intake depth, not just at the surface.
How long does lake water quality restoration take? Meaningful bloom reduction typically requires 3–7 years. Both external load reduction and internal loading management must be pursued simultaneously. Lakes relying on external nutrient reduction alone often see little change in the first 2–5 years due to legacy sediment phosphorus.
How does ultrasound algae control support lake water quality management? Ultrasound units deployed in the photic zone emit low-power acoustic frequencies that disrupt cyanobacteria buoyancy regulation. As a result, cyanobacteria cannot position themselves at optimal light depths. The technology is chemical-free, safe for non-target organisms, and most effective when paired with real-time monitoring.