

Key points
- Eutrophication is the over-enrichment of water with nutrients, mainly nitrogen and phosphorus, which fuels excessive algae growth.
- It is the upstream cause of most algae problems, and the U.S. Environmental Protection Agency links it to at least $2.4 billion in freshwater damages every year.
- For utilities, the effects show up as taste-and-odor complaints, higher treatment costs, oxygen crashes, and harder raw water management.
- Trophic state, measured through phosphorus, chlorophyll-a, and water clarity, tells you how advanced the problem is.
- Control works on two levels: cutting nutrient inputs at the source, and managing algae in the reservoir with monitoring plus chemical-free methods.
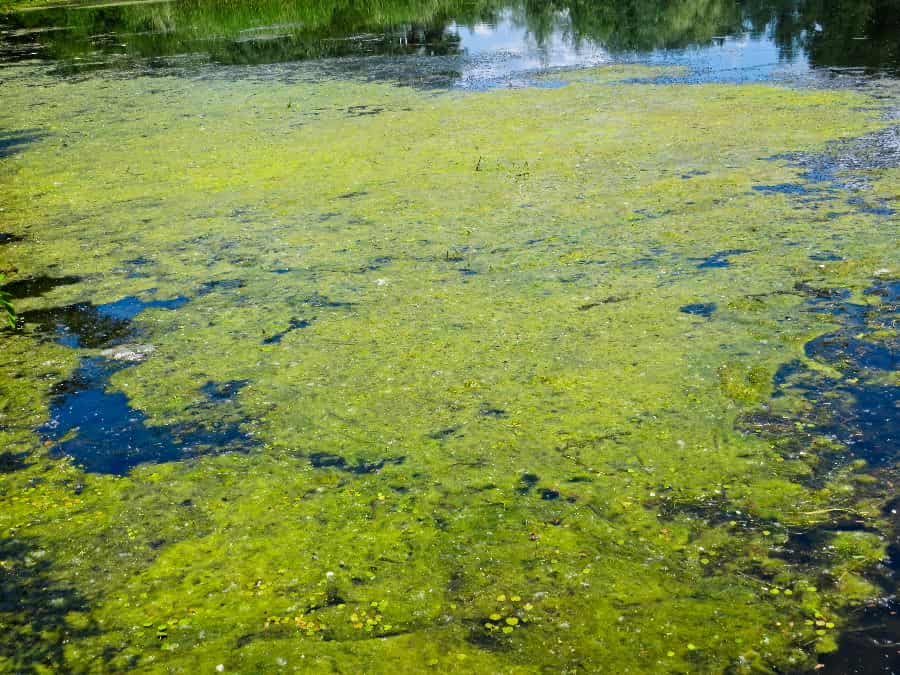
Eutrophication is the process by which a body of water becomes overloaded with nutrients, mainly nitrogen and phosphorus, which triggers the rapid growth of algae and aquatic plants. In short, it is what turns a clear reservoir green. The scale is not small either, because the U.S. Environmental Protection Agency estimates that nutrient pollution and the resulting eutrophication cost U.S. freshwaters at least $2.4 billion every year. For the water utilities and reservoir operators who manage these resources, eutrophication is not an abstract concern. Instead, it is the root driver behind algae blooms, taste-and-odor episodes, and rising treatment costs. This guide explains what eutrophication is, what causes it, how it affects water quality, and how utilities can measure and control it.
What is eutrophication?
Eutrophication describes the gradual enrichment of water with nutrients and the biological changes that follow. As nutrient levels climb, algae and aquatic plants grow faster than the ecosystem can balance. Consequently, the water loses clarity, oxygen patterns shift, and the natural food web comes under stress.
There are two broad types. Natural eutrophication happens slowly over centuries as lakes age and collect sediment. Cultural eutrophication, by contrast, is driven by human activity and unfolds within years rather than millennia. Because the second type is so much faster, it is the one that creates real problems for managed reservoirs and drinking water sources. Although eutrophication is the upstream cause, the visible result is often a bloom, and the most dangerous of these are harmful algal blooms.
What causes eutrophication?
The direct cause of eutrophication is an excess of two nutrients: nitrogen and phosphorus. In most freshwater reservoirs, phosphorus is the limiting nutrient, which means even a small increase can set off a large bloom. Therefore, controlling phosphorus is usually the priority for utilities.
These nutrients reach the water from several sources. The main ones include:
- Agricultural runoff. Fertilizers and animal waste wash off fields and into rivers and reservoirs after rain.
- Wastewater discharge. Treated and untreated sewage adds a steady load of nitrogen and phosphorus.
- Urban stormwater. Runoff from streets, lawns, and construction sites carries nutrients and sediment.
- Atmospheric deposition. Nitrogen from combustion and industry settles onto the water surface.
Climate also amplifies the problem. Warmer water speeds up algae growth, while heavier storms flush more nutrients off the land in a single event. As a result, many operators now see blooms arrive earlier and last longer. Because phosphorus matters so much, tracking it closely is the first practical step, and phosphate monitoring gives utilities the data to act before a bloom takes hold.
One source is easy to overlook: the reservoir itself. Phosphorus that has built up in bottom sediment over many years can release back into the water whenever oxygen runs low, a process known as internal loading. As a result, a reservoir can keep feeding blooms even after the external inputs fall. For managers, this legacy nutrient store is a key reason eutrophication proves so stubborn, and it is also why measuring conditions at depth, not just at the surface, really matters.
What are the stages of eutrophication?
Scientists describe a water body by its trophic state, which is a measure of how nutrient-rich and productive it is. Understanding where a reservoir sits on this scale helps managers judge how urgent the situation is.
- Oligotrophic. Low nutrients, clear water, and high oxygen. This is the healthiest state.
- Mesotrophic. Moderate nutrients with occasional algae growth and early clarity loss.
- Eutrophic. High nutrients, frequent blooms, reduced clarity, and oxygen swings.
- Hypereutrophic. Extreme nutrient loading, dense and persistent blooms, and severe oxygen depletion.
A reservoir can move along this scale in either direction. Without intervention, nutrient loading pushes it toward the eutrophic and hypereutrophic end. With sustained management, however, it can recover toward a healthier state. For that reason, tracking trophic state over time is more useful than any single snapshot.
Season matters too. In summer, warm surface water and longer daylight often push a eutrophic reservoir into its worst blooms. Meanwhile, the water column stratifies, which traps low-oxygen water near the bottom and accelerates internal loading. Because of this pattern, many operators watch the warm months most closely and ramp up monitoring before peak season.
How does eutrophication affect water quality and treatment?
For utilities, the effects of eutrophication land directly on day-to-day operations and budgets. The chain of impacts usually unfolds in the following way.
First, dense algae growth clouds the water and blocks sunlight from reaching deeper plants. Some of this growth develops into harmful algal blooms, and certain species, especially cyanobacterial blooms, release toxins that threaten both aquatic life and drinking water safety.
Next, the oxygen problem follows. When large volumes of algae die, bacteria decompose them and consume oxygen in the process. This creates hypoxia, or severely low oxygen, which can trigger fish kills. At a large scale, the same mechanism produces the hypoxic dead zones that NOAA tracks, including the one in the Gulf that covers thousands of square miles each summer.
The cost at the treatment plant
Finally, treatment gets harder. Algae release taste-and-odor compounds such as geosmin and MIB, which generate customer complaints even at trace levels. Blooms also clog filters, shorten filter run times, and raise the demand for coagulants and oxidants. According to the foundational Dodds study, the added cost of treating drinking water affected by eutrophication runs into hundreds of millions of dollars a year. In practice, that means more chemicals, more labor, and less predictable raw water for the people running the plant.
On top of the operational strain, eutrophication adds regulatory pressure. When toxins appear, a utility may need to issue advisories, increase sampling, and document its response for regulators. Therefore, staying ahead of nutrient enrichment is not only cheaper but also far simpler from a compliance standpoint.
Stay ahead of the bloom, not behind it
LG Sonic helps water utilities and reservoir operators monitor nutrients in real time and control algae without chemicals. Explore our ultrasonic algae control technology or see how utilities apply it in our case studies.
How is eutrophication measured and assessed?
Because eutrophication develops gradually, regular measurement is the only reliable way to catch it early. Utilities typically watch a handful of indicators together rather than relying on one.
- Total phosphorus and nitrogen. The nutrients that drive the whole process.
- Chlorophyll-a. A direct proxy for how much algae is present.
- Water clarity. Often measured with a Secchi depth reading.
- Dissolved oxygen. Profiled at different depths to spot stratification and hypoxia.
Combined, these readings define the trophic state and reveal the trend. Grab samples taken by hand give occasional snapshots, yet conditions can change within days. Continuous, multi-depth measurement therefore offers a far clearer picture. A vertical profiler records water quality at several depths around the clock, and a digital twin turns that data into forecasts, so operators can see a bloom forming before it reaches the surface.
How can you prevent and control eutrophication?
Managing eutrophication works best on two levels at once, because each addresses a different part of the problem.
Reduce nutrients at the source
The root fix is to cut the nutrients entering the water in the first place. Watershed practices such as buffer strips, improved fertilizer management, and better wastewater treatment all reduce the load. This approach delivers the most durable results. However, it is slow and often depends on cooperation across many landowners and agencies. In addition, restoring wetlands and stabilizing eroding banks can intercept nutrients before they ever reach the water.
Manage algae in the reservoir
When nutrients are already present, in-reservoir methods help keep algae under control. Each option carries trade-offs, so honest comparison matters:
- Chemical algaecides act fast, yet they require repeated dosing, are not selective, and can leave residues.
- Aeration and mixing support oxygen levels and reduce stratification, although they add energy and capital costs.
- Ultrasonic algae control offers a chemical-free way to manage algae growth near the surface, and it works as a complementary tool alongside monitoring rather than a single fix.
For the bloom-management side specifically, our complete guide to harmful algal blooms covers detection and response in depth. Because eutrophication is the underlying driver, the strongest programs pair source reduction with continuous monitoring and targeted, chemical-free control in the water itself.
Frequently asked questions about eutrophication
Is eutrophication reversible?
Yes, but slowly. With sustained reductions in nutrient inputs and active management, a water body can shift back toward a healthier trophic state. Recovery usually takes years rather than months, since nutrients stored in sediment continue to feed algae for some time.
What is the difference between eutrophication and a harmful algal bloom?
Eutrophication is the cause, and a bloom is the symptom. Nutrient over-enrichment sets the stage, and a harmful algal bloom is one possible result. You can read more in our guide to harmful algal blooms.
Is eutrophication the same as cyanobacteria?
No. Cyanobacteria, often called blue-green algae, are a group of organisms that thrive in nutrient-rich water and can produce toxins. Eutrophication creates the conditions they need. For detail on the organisms themselves, see our article on cyanobacterial blooms.
Which nutrient causes eutrophication the most?
Both nitrogen and phosphorus contribute. In most freshwater reservoirs, however, phosphorus is the limiting nutrient, so reducing it tends to give utilities the greatest control.
What are the signs of eutrophication in a reservoir?
The clearest signs include green or cloudy water, surface scums, and a sharp drop in clarity. In addition, operators often notice taste-and-odor complaints, low oxygen readings at depth, and, in severe cases, fish kills. Because these signs tend to appear together, tracking several indicators at once gives the most reliable early warning.
Does climate change make eutrophication worse?
Yes. Warmer water speeds up algae growth, and heavier storms wash more nutrients off the land in single events. As a result, many reservoirs now see blooms that start earlier and last longer than they did a decade ago.
Eutrophication is a manageable problem, not an inevitable one. The utilities that stay ahead of it treat nutrient enrichment as a measurable trend and act early, well before a bloom forces a costly response. With real-time monitoring across depths, predictive modeling, and chemical-free algae control, LG Sonic helps reservoir operators protect water quality and keep treatment costs under control. To see how this fits your reservoir, explore our solutions for drinking water reservoirs or get in touch with our team.
Trusted by water utilities, irrigation operators, and industrial water managers in 60+ countries
Curious whether ultrasonic control fits your reservoir?
Every treatment plant has a different source water profile, algae history, and operational constraints. Our water quality engineers review your specific site conditions, source water data, basin configuration, treatment setup, and regulatory requirements, then design a monitoring and control programme built for your plant, not a generic template.