
Real-time water quality monitoring helps drinking water utilities detect contamination risks before they impact treatment operations. Using continuous sensors, automated alerts, and predictive analytics, utilities monitor algae, cyanobacteria, dissolved oxygen, pH, and temperature at 15-minute intervals—catching problems that weekly or monthly grab sampling would miss entirely.
The safety of drinking water depends on what happens long before treatment. By the time contaminated water reaches a treatment plant, the damage—operational disruption, taste and odor complaints, regulatory violations—has already begun. Real-time water quality monitoring changes that equation. It detects problems at the source, when intervention is still possible.
For water utilities managing surface water reservoirs, continuous monitoring is no longer optional. Harmful algal blooms can double in biomass within 48 hours under the right conditions. Grab sampling, performed weekly or monthly, misses the inflection point. Real-time systems catch it.
This article explains how real-time water quality monitoring works, why it outperforms traditional methods, and how utilities use it to protect drinking water supplies before contamination reaches the tap.
What is Real-Time Water Quality Monitoring?
Real-time water quality monitoring refers to the continuous measurement of physical, chemical, and biological parameters in a water body, transmitted automatically to operators without manual sample collection. Unlike grab sampling—where a technician visits a site, collects water, and sends it to a lab—real-time systems use in-situ sensors that measure conditions every 15 minutes to one hour and report data via cellular or satellite connection.
The distinction matters. Grab sampling provides a snapshot of conditions at a single moment. Real-time monitoring provides a continuous record. When cyanobacteria populations surge overnight, grab sampling scheduled for next Tuesday will not detect it until the bloom is already established. Real-time monitoring flags the change within hours.
Modern systems measure parameters including chlorophyll-a concentration (total algae biomass), phycocyanin (cyanobacteria-specific pigment), dissolved oxygen, water temperature, pH, and turbidity. Some advanced platforms also measure nutrients directly. Phosphate concentration, for example, predicts bloom risk weeks before visible algae appear. Systems like the Phosphate Monitoring solution provide early warning of nutrient loading events that traditional grab sampling would miss until algae densities spike.
Data flows to a central dashboard where operators track trends, set automated alerts, and compare current conditions against historical baselines. When chlorophyll-a exceeds a threshold—say, 10 µg/L at a raw water intake—the system sends an alert. Operators intervene before the bloom reaches the treatment plant.
Why Continuous Monitoring Outperforms Grab Sampling
Grab sampling was designed for an era when water quality changed slowly and treatment infrastructure could handle variability. That era has ended. Climate change has extended harmful algal bloom seasons across North America and Europe. Utilities must now adapt to emerging water trends and year-round HAB risks that traditional seasonal monitoring cannot address. In a 2020 study published by the U.S. Environmental Protection Agency, researchers documented a 30-year increase in bloom frequency and intensity across freshwater systems, driven by warmer temperatures and altered precipitation patterns.
Utilities operating under these conditions face three problems that grab sampling cannot solve.
Factor | Grab Sampling | Real-Time Monitoring |
Sampling Frequency | Weekly/Monthly | Every 15-60 minutes |
Detects Overnight Events | No | Yes |
Spatial Coverage | Single point | Multi-point deployment |
Early Warning Capability | Low | High |
Labor Requirement | High (field visits + lab) | Low (automated) |
Data Continuity | Gaps between samples | Continuous record |
Predictive Capability | None | Advanced forecasting |
Blooms Develop Faster Than Sampling Schedules
Cyanobacteria populations can double every 24 to 48 hours when water temperature exceeds 20°C and nutrients are available. A lake sampled on Monday at safe chlorophyll-a levels (5 µg/L) can exceed bloom thresholds (25 µg/L) by Thursday. If the next scheduled sample is the following Monday, operators have no warning. By the time the lab result arrives, the bloom has already impacted raw water quality.
Real-time systems eliminate that gap. Continuous monitoring detects the exponential growth phase as it begins. Operators see chlorophyll-a rise from 5 µg/L to 12 µg/L over 48 hours and act immediately—whether that means activating treatment, increasing monitoring frequency, or deploying source water controls.
Spatial Variability Requires Multiple Monitoring Points
Surface water reservoirs are not uniform. Algae concentrate in areas with optimal light, temperature, and nutrient availability—often near inflows, in shallow coves, or along windward shores. A single grab sample taken at the dam may not reflect conditions 2 kilometers upstream where the raw water intake sits.
Real-time monitoring allows utilities to deploy multiple sensors across a reservoir. One near the intake, one at the inflow, one in the deepest section. When phycocyanin levels spike at the inflow, operators know a cyanobacteria bloom is moving toward the intake and can adjust operations accordingly.
Night and Weekend Events Go Undetected
Algae activity follows diurnal patterns. Photosynthesis during daylight hours drives pH up and dissolved oxygen supersaturation. At night, respiration reverses those trends. A grab sample taken at 10 a.m. on a Tuesday does not capture what happened at 3 a.m. Sunday, when a hypoxic event killed fish or when a nutrient pulse from a storm entered the reservoir.
Real-time systems record everything. The data historian stores every 15-minute reading. Operators reviewing the weekly trend see the overnight spike in turbidity that coincided with Friday’s rainstorm, or the sudden pH drop that signals a bloom crash and toxin release.
Complete Reservoir Visibility: Real-Time Monitoring at Three Levels
The challenge of spatial variability extends beyond horizontal coverage. Water quality varies by depth, across the reservoir surface, and over time. A comprehensive monitoring strategy must account for all three dimensions.
Modern reservoir monitoring operates at three levels:
Surface Monitoring
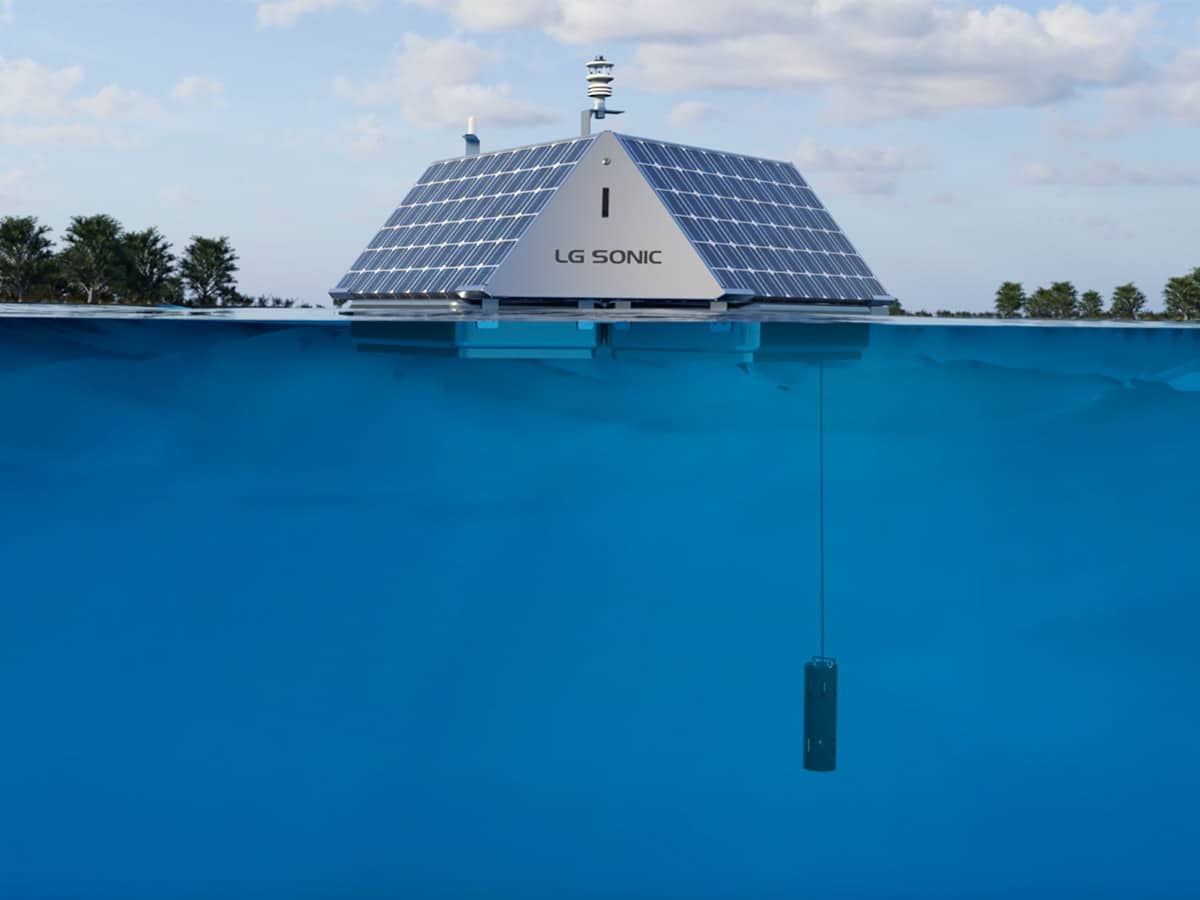
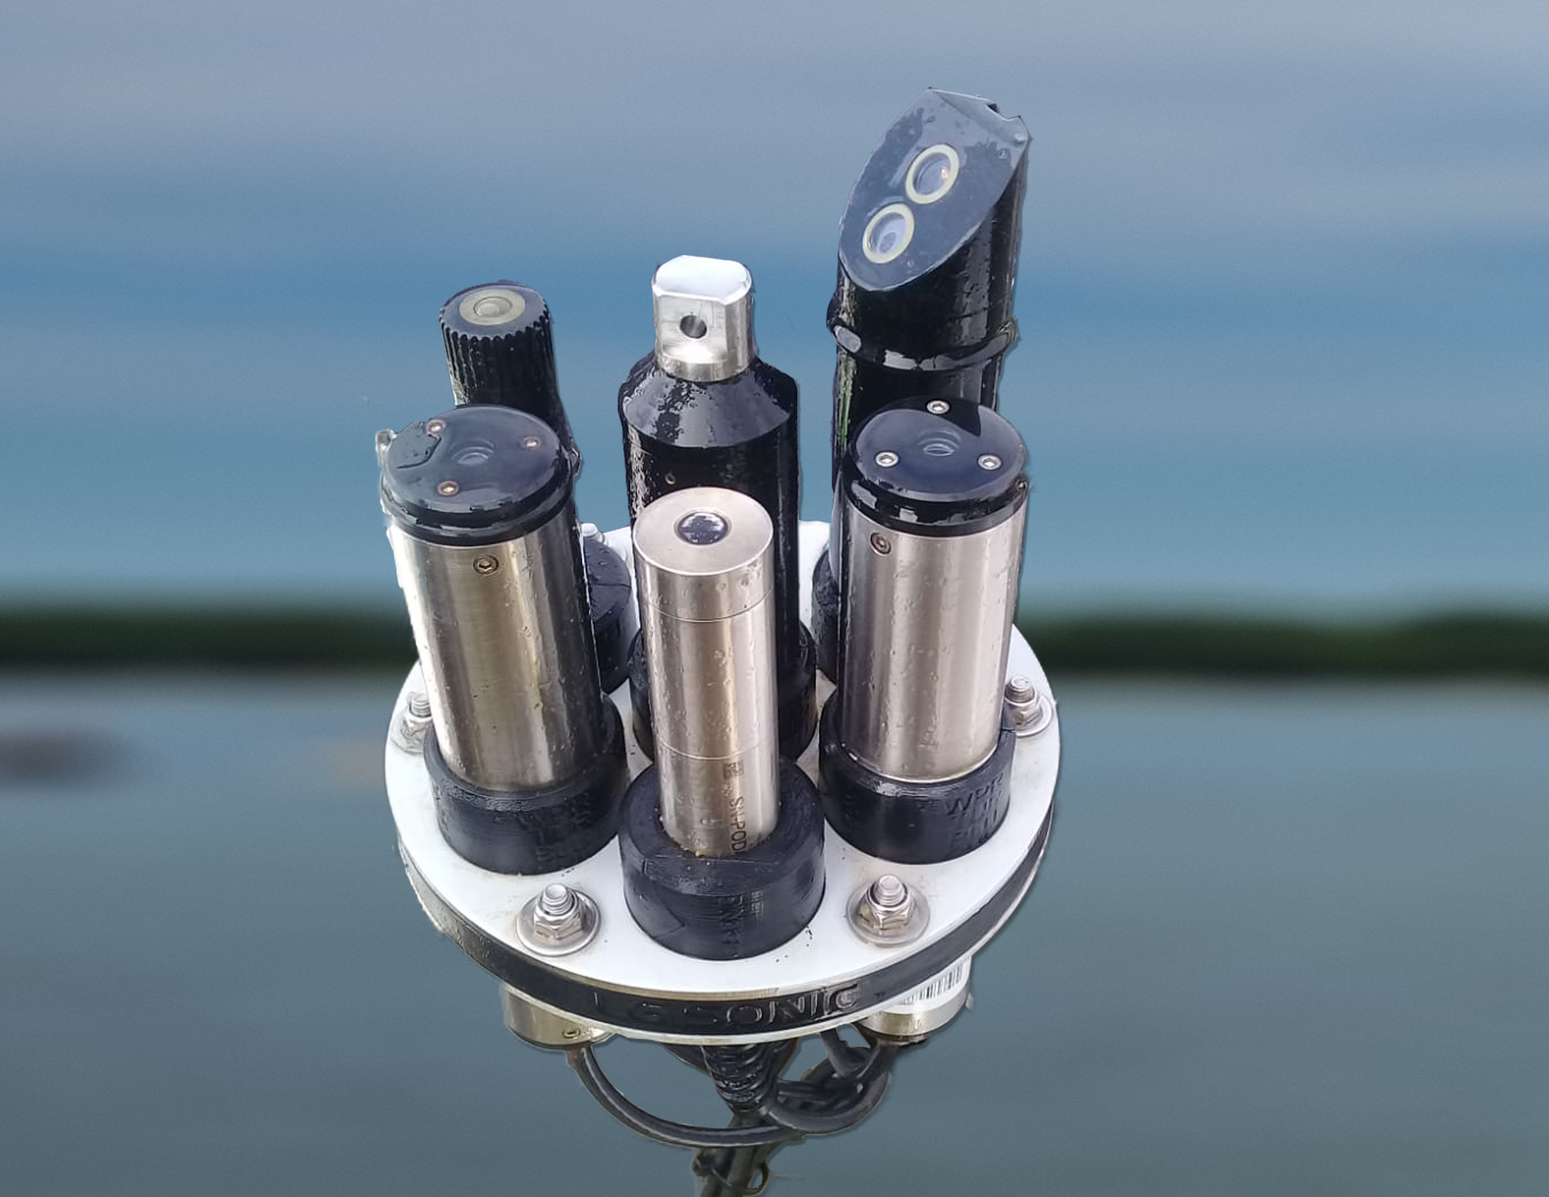
Surface monitoring tracks conditions at fixed points using autonomous buoys equipped with real-time sensors. The LG Sonic Monitoring Buoy measures chlorophyll-a, phycocyanin, dissolved oxygen, temperature, and pH at the water surface, transmitting data every 15 minutes. Surface monitoring detects bloom formation at intake locations and high-risk zones.
Operational example: At 2:00 AM, phycocyanin levels at the inflow buoy exceed 8 µg/L threshold. The system sends an SMS alert to the on-call operator. By 6:00 AM, intake depth adjustments are implemented, drawing water from below the surface bloom layer before cyanobacteria concentration reaches the raw water intake.
Water Column Profiling
Water column profiling measures parameters at multiple depths, revealing stratification patterns and bottom-layer conditions that surface sensors miss. The Vertical Profiler descends through the water column on a programmed schedule, collecting depth-resolved data for temperature, dissolved oxygen, chlorophyll-a, and phycocyanin. When the hypolimnion becomes anoxic and phosphorus releases from sediment, vertical profiling detects it before nutrients reach the surface and fuel algae growth.
Remote Sensing from Satellite and Aerial Platforms
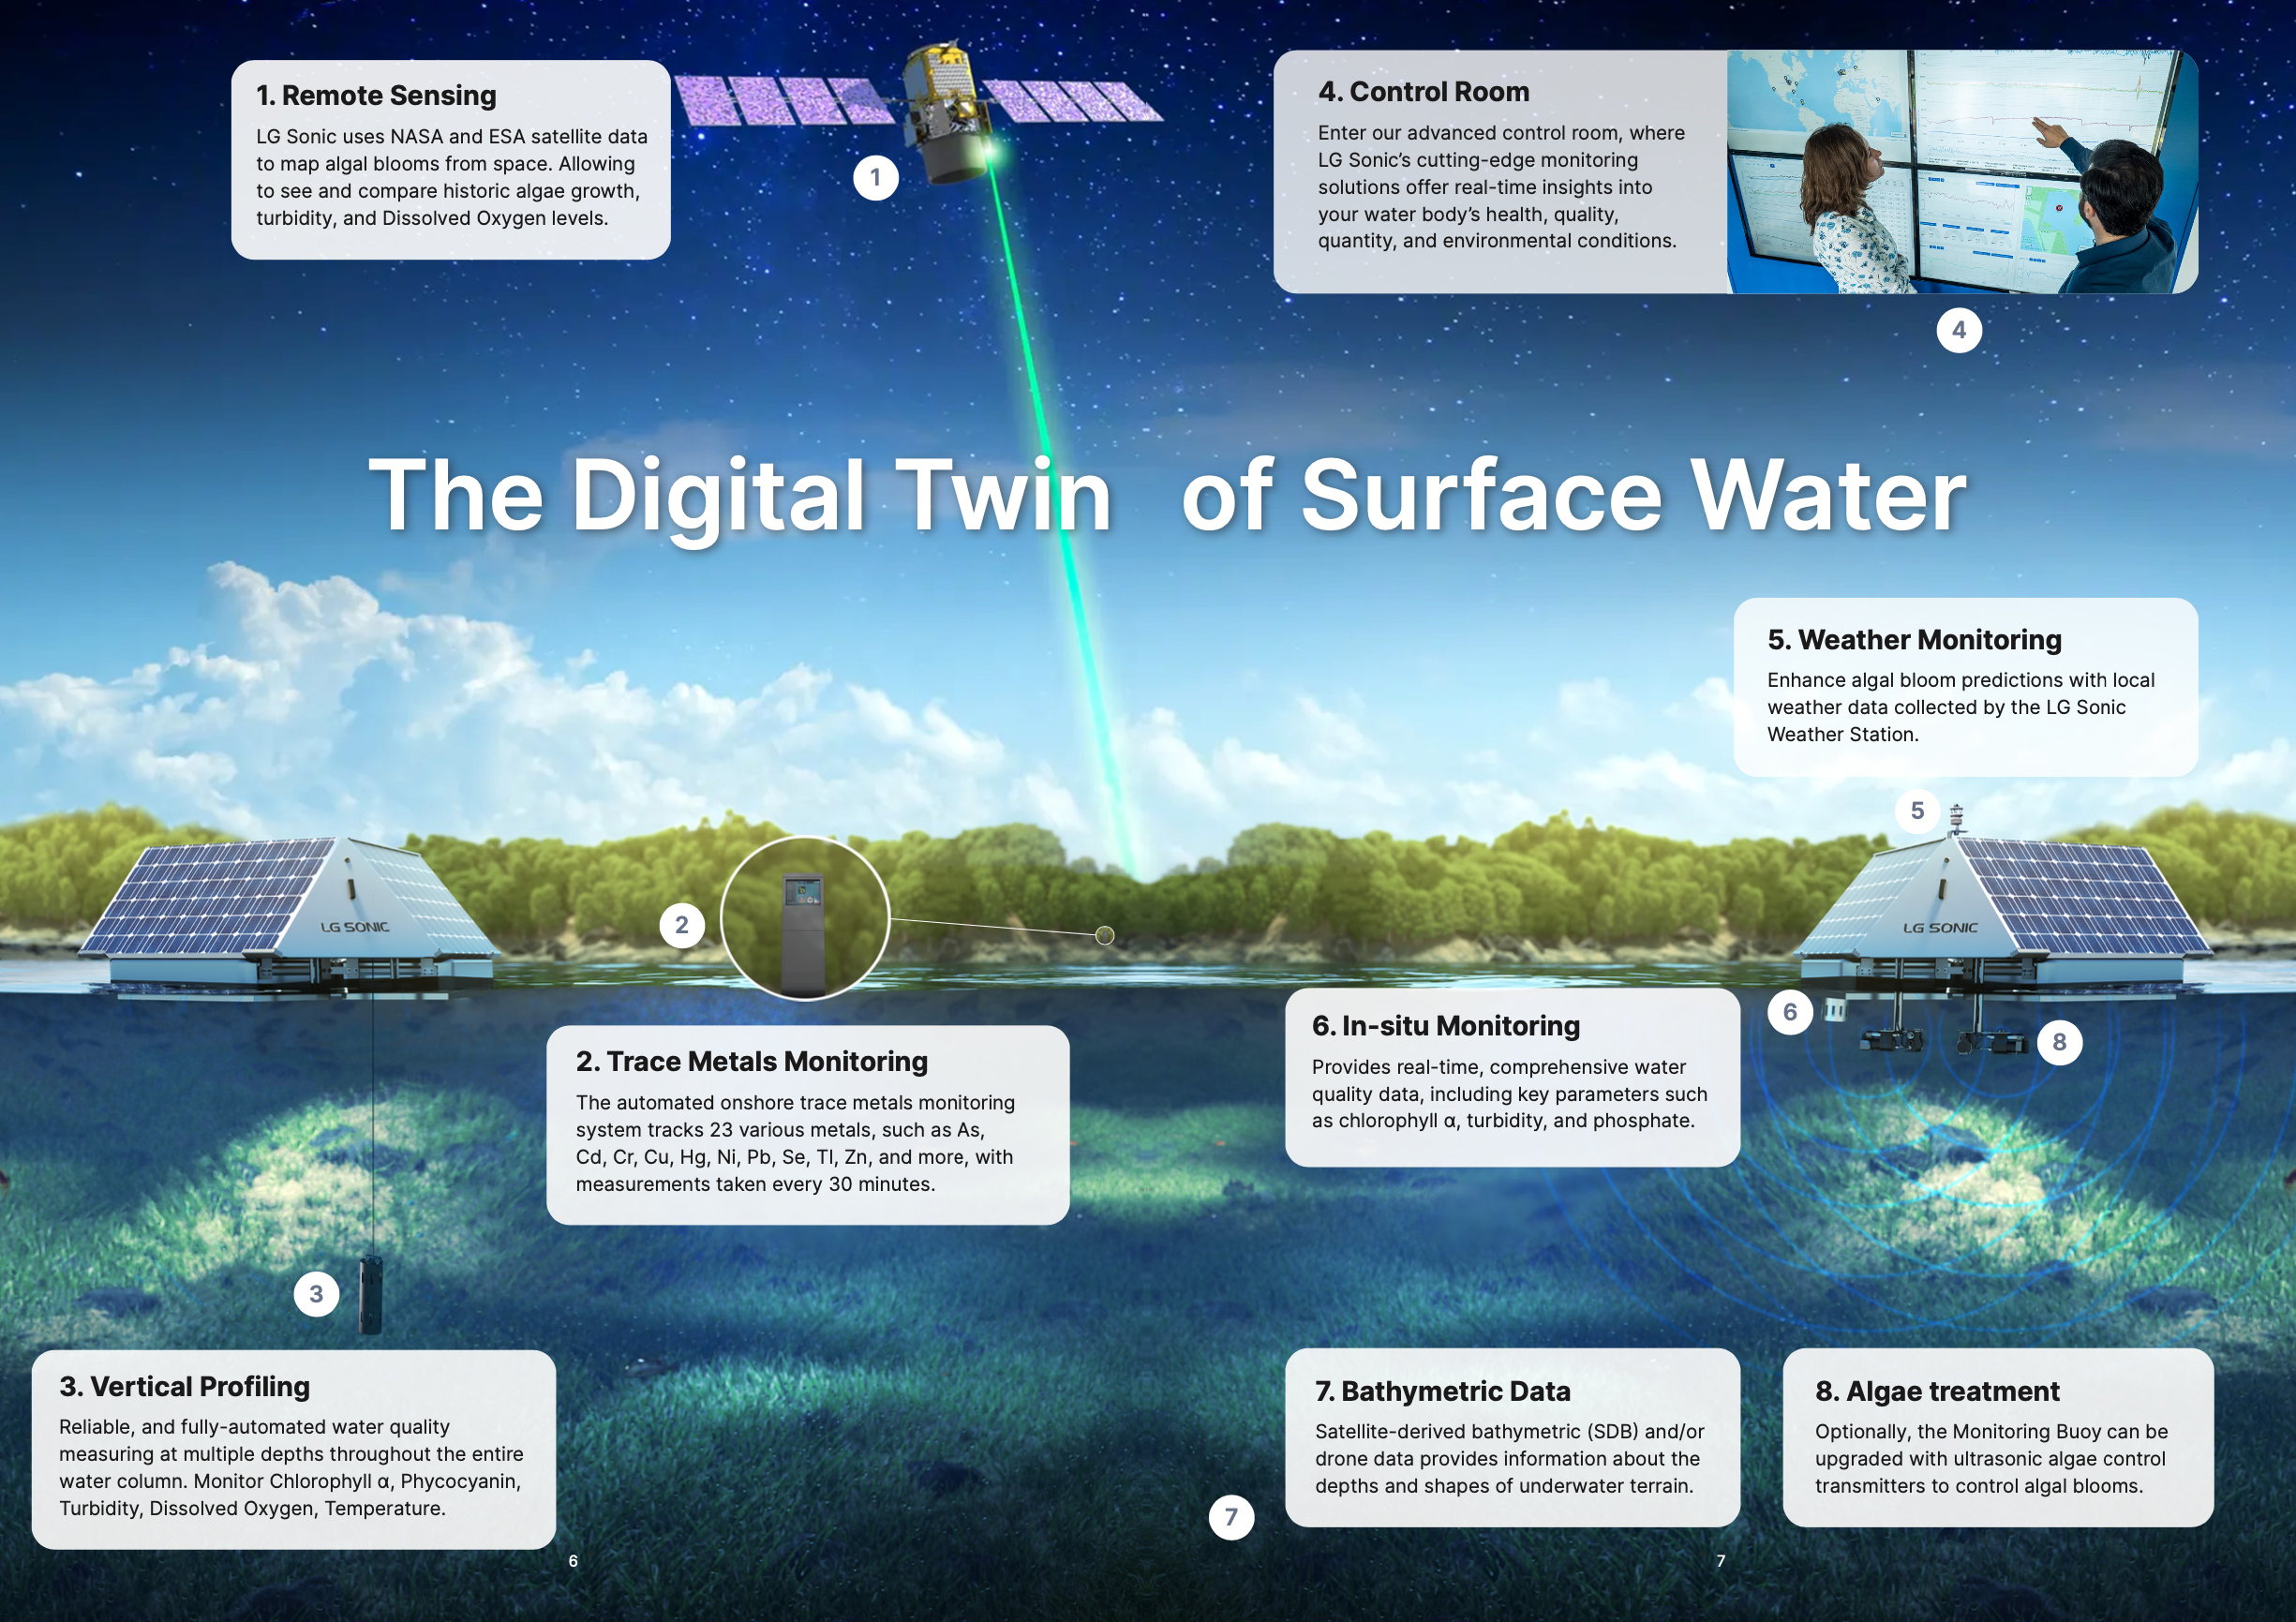
Remote sensing maps water quality across the entire reservoir surface. The LG Sonic Remote Sensing solution uses multispectral satellite imagery to estimate chlorophyll-a concentration and detect algae distribution patterns across thousands of hectares. Remote sensing identifies bloom hotspots that fixed sensors would miss and tracks bloom movement in response to wind and currents.
Kremenchuk reservoir Chlorophyl level
Integrated Monitoring Solutions
When combined, these three monitoring levels provide complete spatial and temporal coverage:
- Monitoring Buoy — Real-time surface monitoring for chlorophyll-a, phycocyanin, DO, pH, and temperature at critical locations
- Vertical Profiler — Automated depth profiling for stratification monitoring and hypolimnetic water quality
- Remote Sensing Platform — Satellite-based algae mapping across entire reservoir surface areas
- Digital Twin Platform — Predictive bloom forecasting using integrated data from all monitoring levels
All data streams into MPC-View, the central platform where operators visualize trends across all sensors, set alert thresholds for each parameter, and compare current conditions against historical patterns. Operators see the full picture: where algae are now, where they are moving, and what subsurface conditions will drive growth next week.
The Digital Twin platform unifies data from all three levels into a single predictive model. The system ingests surface sensor data, vertical profiles, satellite imagery, and weather forecasts, then predicts chlorophyll-a levels 7 to 14 days into the future. Utilities using this approach shift from reactive monitoring to predictive management—intervening before blooms establish rather than responding after they appear.
The ROI of Real-Time Water Quality Monitoring
Real-time water quality monitoring is not a regulatory checkbox. It is an operational investment with measurable returns. Utilities that deploy continuous monitoring report cost savings in three areas: chemical treatment, operational disruption, and regulatory compliance.
Reduced Chemical Costs
When a cyanobacteria bloom reaches a drinking water treatment plant, operators respond by increasing coagulant, oxidant, and activated carbon dosing to remove taste and odor compounds—primarily geosmin and 2-methylisoborneol (MIB). These adjustments are expensive. A 2017 analysis by the Water Research Foundation estimated that a single taste and odor event at a mid-sized utility (50 MGD) costs $50,000 to $150,000 in additional treatment chemicals and labor.
Real-time monitoring prevents that scenario. By detecting elevated phycocyanin levels at the raw water source, operators activate upstream controls—such as ultrasonic algae management or circulation systems—before bloom biomass reaches concentrations that produce taste and odor. The intervention happens at the source, not at the plant.
How Vallecitos Water District reduced chemical treatment costs and avoided operational disruption through real-time source water monitoring
Vallecitos Water District in California serves 30,000+ customers from surface water reservoirs vulnerable to seasonal algae blooms. Before implementing real-time monitoring, operators reacted to blooms after they impacted treatment operations, requiring costly chemical adjustments and overtime staff response. After deploying continuous phycocyanin and chlorophyll-a monitoring, the utility detected blooms 48-72 hours earlier, activated source water management proactively, and reduced emergency chemical treatment episodes by over 60%.
Avoided Operational Disruption
Utilities that rely on grab sampling often learn about water quality problems only after customer complaints begin. By that time, the treatment plant is already struggling with elevated turbidity, algae clogging filters, or taste and odor compounds breaking through finished water.
Real-time systems provide advance warning. Operators see raw water quality trends 48 to 72 hours before they reach the intake. That lead time allows for planned interventions—adjusting reservoir operations, pre-treating source water, or shifting to an alternate intake—rather than emergency responses.
The operational benefit extends beyond algae. Continuous monitoring detects stratification breakdowns, stormwater inflows, and temperature inversions that affect treatment plant performance. Operators manage these events proactively, maintaining consistent finished water quality without unplanned process changes.
Regulatory Compliance and Liability Protection
Regulatory agencies increasingly expect utilities to demonstrate proactive water quality management. In the United States, the EPA’s Revised Total Coliform Rule and state-level harmful algal bloom response frameworks require utilities to document source water monitoring when cyanotoxins are detected. Real-time monitoring systems generate that documentation automatically.
When a toxin event occurs, utilities with continuous monitoring data can demonstrate to regulators and the public that they detected the problem early, took appropriate action, and maintained safe finished water. That record protects against liability claims and regulatory enforcement. Utilities without continuous data face harder questions: When did the problem start? Why wasn’t it detected sooner? What was the utility doing during the critical window?
Key Parameters for Drinking Water Source Monitoring
Not every water quality parameter requires real-time measurement. Utilities must prioritize based on source water characteristics, treatment plant vulnerabilities, and regulatory requirements. For drinking water reservoirs, five parameters provide the highest value.
Chlorophyll-a (Total Algae Biomass)
Chlorophyll-a is the universal algae indicator. All photosynthetic algae contain it, so chlorophyll-a concentration serves as a proxy for total algae biomass. Real-time chlorophyll-a sensors use fluorescence—shining light at a specific wavelength and measuring the emitted fluorescence intensity.
For drinking water utilities, chlorophyll-a thresholds typically range from 10 to 25 µg/L depending on local conditions. Values above 25 µg/L indicate moderate to high algae density, which correlates with increased treatment difficulty and higher risk of taste and odor. For comprehensive guidance on preventing algal blooms in reservoirs, see our prevention strategies guide.
Phycocyanin (Cyanobacteria-Specific Indicator)
Not all algae produce toxins. Only cyanobacteria (blue-green algae) pose a public health risk in drinking water. Phycocyanin is a pigment unique to cyanobacteria, so measuring it differentiates harmful algae from harmless diatoms or green algae.
Real-time phycocyanin sensors allow utilities to track cyanobacteria populations independently from total algae. When chlorophyll-a is elevated but phycocyanin is low, the bloom is likely diatoms—a nuisance for filter operation but not a toxin risk. When phycocyanin spikes, operators know cyanobacteria dominate the bloom and toxin risk is present. Understanding harmful algal bloom toxicity helps operators assess health risks and determine appropriate response measures.
Dissolved Oxygen (DO)
Dissolved oxygen reveals the metabolic state of a water body. Healthy reservoirs maintain DO levels above 5 mg/L in the epilimnion (surface layer). When algae blooms, daytime photosynthesis drives DO supersaturation (>12 mg/L), while nighttime respiration crashes DO to hypoxic levels (<2 mg/L).
Real-time DO profiling—measuring DO at multiple depths—also detects stratification. When the hypolimnion (bottom layer) becomes anoxic, phosphorus and metals dissolve from sediment and become available to fuel algae growth. Understanding these lake ecosystem water quality dynamics is critical for interpreting DO profiles and predicting bloom conditions. Early detection of anoxia allows operators to activate mixing systems or adjust intake depth before water quality degrades.
Water TemperatureBerthoud, Colorado, provides a case example—read the full Berthoud water quality case study for detailed implementation results.
Temperature governs algae growth rates, stratification patterns, and chemical treatment efficiency. Cyanobacteria growth accelerates above 20°C and peaks around 28°C. Real-time temperature data, measured at multiple depths, predicts bloom risk weeks in advance.
Temperature also determines when reservoirs stratify and destratify. For utilities managing industrial water operations, temperature monitoring is equally critical for cooling tower efficiency and process water management. Stratification locks nutrients in the hypolimnion; destratification redistributes them throughout the water column, triggering blooms.
pH
pH reflects photosynthetic activity. During algae blooms, photosynthesis removes CO₂ from water, driving pH up from neutral (7.0) to alkaline (9.0+). High pH complicates coagulation, increases ammonia toxicity, and alters disinfectant effectiveness.
Real-time pH monitoring at the source gives operators advance notice of pH swings before they reach the treatment plant. High pH episodes during algae blooms often correlate with taste and odor problems in drinking water, making pH trends a valuable early warning indicator. Some utilities use source water pH trends as a leading indicator of algae activity, especially in systems where chlorophyll-a sensors are not yet deployed.
How Water Utilities Use Real-Time Monitoring Data
Data is valuable only when it informs decisions. Utilities integrate real-time water quality monitoring into operations through three mechanisms: automated alerts, trend analysis, and predictive modeling.
Automated Alerts
Operators cannot watch dashboards 24/7. Real-time systems compensate by triggering alerts when parameters exceed thresholds. A typical alert configuration in MPC-View might include:
- Chlorophyll-a > 15 µg/L (warning) or > 25 µg/L (action)
- Phycocyanin > 5 µg/L (cyanobacteria present)
- DO < 3 mg/L (hypoxic conditions)
- Temperature > 22°C in surface layer (bloom risk elevated)
Alerts route to operators via email, SMS, or SCADA integration. The response depends on severity. A chlorophyll-a warning might prompt increased visual inspections. A phycocyanin action alert triggers source water treatment activation or raw water intake depth adjustment.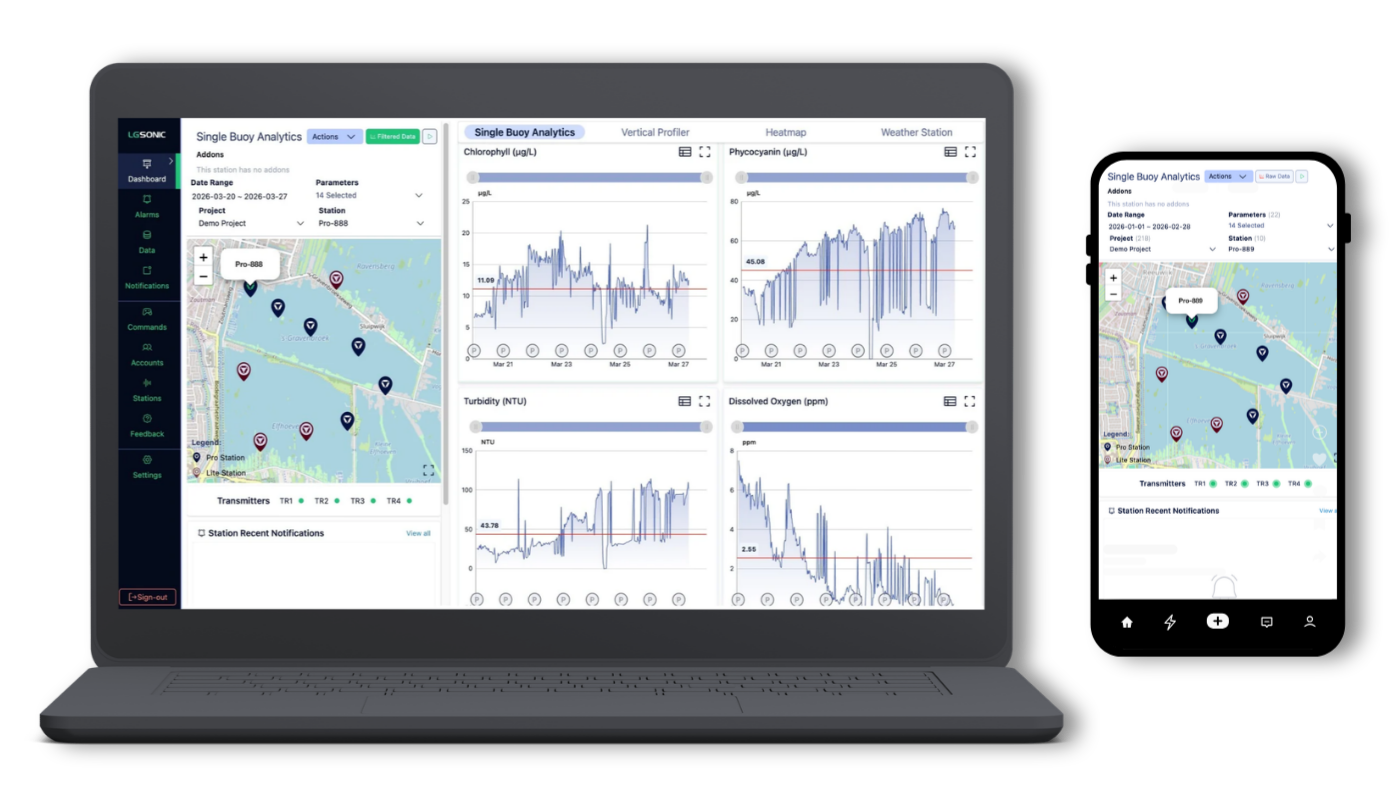
Trend Analysis
Single data points are snapshots. Trends reveal trajectory. Operators using MPC-View review weekly chlorophyll-a trends to distinguish between stable background levels (seasonal baseline around 8 µg/L) and exponential growth (doubling every 48 hours). The shape of the curve determines the response.
Trend analysis also identifies recurring patterns. If chlorophyll-a spikes every June when water temperature crosses 20°C, operators schedule preventive interventions in May. If phycocyanin correlates with west wind events that concentrate surface scum at the intake, operators adjust intake depth during those conditions.
Predictive Modeling
Advanced utilities pair real-time monitoring data with predictive models. Machine learning algorithms trained on historical data forecast chlorophyll-a levels 7 to 14 days into the future based on current water temperature, nutrient levels, and weather forecasts. When the model predicts elevated bloom risk, operators activate preventive measures before algae densities rise.
The ability to intervene 10 days before a bloom materializes reduces chemical costs and operational disruption compared to reacting after chlorophyll-a exceeds thresholds.
Integrating Real-Time Monitoring with Source Water Management
Real-time monitoring generates data. Source water management acts on it. The two are complementary. Monitoring detects the problem; management solves it.
Utilities with both capabilities operate a closed-loop system. Real-time monitoring identifies emerging problems, while source water treatment strategies address them before contamination reaches the intake. Real-time sensors detect elevated phycocyanin. Operators activate ultrasonic algae control or circulation systems at the source. Sensors confirm that chlorophyll-a stabilizes or declines. If levels continue rising, operators adjust the intervention or escalate to backup measures.
How Town of Berthoud achieved measurable source water quality improvement at Carter Lake Reservoir through continuous monitoring and intervention
Carter Lake Reservoir supplies drinking water to Berthoud, Colorado. Seasonal cyanobacteria blooms historically required reactive treatment responses and increased chemical costs. After deploying real-time monitoring combined with ultrasonic source water management, operators detected early-stage bloom development and intervened before contamination reached intake levels. Chlorophyll-a concentrations stabilized below 15 µg/L throughout the bloom season, eliminating taste and odor complaints and maintaining consistent raw water quality for the treatment plant.
Without real-time monitoring, source water management operates blind. Operators deploy controls on a schedule or in response to visual observations, with no objective feedback on effectiveness. With real-time data streaming into MPC-View, management decisions are evidence-based. Operators know within 48 hours whether the intervention worked.
Choosing a Real-Time Monitoring System
Not all real-time monitoring systems deliver equal value. Utilities evaluating options should assess five criteria: parameter accuracy, deployment flexibility, data integration, maintenance requirements, and total cost of ownership.
Parameter accuracy varies by sensor type. Optical sensors (fluorescence-based) for chlorophyll-a and phycocyanin are industry standard, but calibration drift is common. Systems that require monthly manual calibration impose operational burden. Look for sensors with 3-month to 6-month calibration intervals and automated quality control checks.
Deployment flexibility matters because surface water conditions vary. Shallow reservoirs require different mounting approaches than deep stratified lakes. Some systems deploy on fixed platforms (piers, bridges); others use autonomous buoys. Buoy-based systems offer mobility—operators can relocate sensors to track algae hotspots or seasonal patterns.
Data integration is essential. Real-time monitoring data must integrate with existing SCADA or asset management systems. The best platforms offer API access, allowing utilities to pull data into centralized dashboards alongside treatment plant operations, pump station status, and distribution system pressure.
Maintenance requirements determine operational feasibility. In-situ sensors foul. Algae, biofilm, and sediment accumulate on optical windows, degrading measurement accuracy. Systems with automated cleaning—mechanical wipers or air purge systems—reduce maintenance frequency from biweekly site visits to monthly or quarterly servicing. For utilities managing multiple remote sites, this difference determines whether the system is practical.
Total cost of ownership includes more than capital cost. A system with low upfront cost but high maintenance labor, expensive consumables (cleaning solutions, replacement sensors), and short sensor lifespan (2-year replacement cycles) often costs more over 5 years than a higher-quality platform with 5-year sensor life and minimal maintenance.
Calculate total cost of ownership over 5 years, including capital, annual maintenance contracts, sensor replacements, cellular data plans, and labor for site visits. That number is the real cost.
Frequently Asked Questions
What is real-time water quality monitoring?
Real-time water quality monitoring uses in-situ sensors to continuously measure parameters like chlorophyll-a, phycocyanin, dissolved oxygen, temperature, and pH in drinking water reservoirs. Data transmits automatically to operators every 15-60 minutes, providing continuous visibility into source water conditions without manual sample collection.
How often should drinking water reservoirs be monitored?
Real-time monitoring systems measure parameters every 15 to 60 minutes, providing continuous data. This frequency is necessary because harmful algal blooms can double in biomass within 48 hours. Weekly or monthly grab sampling cannot detect rapid changes in water quality that occur between sampling events.
What parameters should utilities monitor in real time?
For drinking water reservoirs, the five most critical parameters are: (1) chlorophyll-a for total algae biomass, (2) phycocyanin for cyanobacteria detection, (3) dissolved oxygen for stratification and ecological health, (4) temperature for bloom risk prediction, and (5) pH for treatment optimization. Some systems also monitor turbidity and specific nutrients like phosphate.
Can real-time monitoring detect cyanobacteria before blooms form?
Yes. Phycocyanin sensors detect cyanobacteria populations at low concentrations before visible blooms appear. When combined with temperature and nutrient monitoring, utilities can predict bloom formation 7-14 days in advance and activate preventive source water management before cyanobacteria densities reach problematic levels.
What is the difference between grab sampling and continuous monitoring?
Grab sampling collects water at a single point in time (weekly or monthly) and requires lab analysis. Continuous monitoring uses automated sensors that measure parameters every 15-60 minutes and transmit data in real time. Continuous systems detect overnight events, rapid changes, and spatial variability that grab sampling misses entirely.
How much does a real-time monitoring system cost?
Capital costs vary based on sensor configuration, deployment method, and data integration requirements. However, total cost of ownership should be calculated over 5 years, including sensor replacements, maintenance contracts, cellular data, and labor. Many utilities find that preventing a single taste and odor event ($50,000-$150,000 in treatment costs) justifies the monitoring investment.
Can monitoring systems integrate with existing SCADA platforms?
Yes. Modern real-time monitoring platforms offer API access and standard data protocols that allow integration with SCADA, asset management systems, and centralized operations dashboards. This allows operators to view reservoir water quality data alongside treatment plant operations and distribution system performance in a single interface.
What causes harmful algal blooms in drinking water reservoirs?
Harmful algal blooms result from the combination of excess nutrients (primarily phosphorus and nitrogen), warm water temperatures (typically above 20°C), sunlight, and calm water conditions. Climate change has extended bloom seasons and increased bloom intensity by raising water temperatures and altering precipitation patterns that affect nutrient loading.
Conclusion
Real-time water quality monitoring transforms drinking water management from reactive to proactive. Utilities no longer wait for lab results to discover that a cyanobacteria bloom has established. They detect elevated phycocyanin within hours of the first population increase and intervene before biomass reaches problematic levels.
The operational benefits—reduced chemical costs, avoided disruption, regulatory compliance—are measurable. The strategic value is harder to quantify but equally important: confidence. Operators managing surface water supplies under climate-driven variability need real-time visibility into source water conditions. Continuous monitoring provides that visibility.
For utilities still relying on weekly or monthly grab sampling, the transition to real-time monitoring is not optional. It is the infrastructure upgrade that allows them to manage 2026 water quality with 2026 tools, not 2006 methods.
Building an Integrated Monitoring Strategy
The next step is building an integrated monitoring strategy that combines surface sensors, depth profiling, remote sensing, and predictive analytics into a unified operational framework. Utilities that deploy comprehensive monitoring systems gain the visibility needed to shift from reactive treatment to proactive reservoir management—detecting problems at the source, intervening before contamination reaches intakes, and protecting drinking water quality before it impacts customers.
To learn more about how real-time monitoring integrates into a comprehensive water quality management strategy, explore our Introduction to Water Quality Monitoring Systems.
Trusted by water utilities, irrigation operators, and industrial water managers in 55+ countries
You’ve read the guide. Now apply it to your reservoir.
Every reservoir has a different bloom history, nutrient loading pattern, and operational constraint. Our water quality engineers review your specific site conditions, source water data, bloom seasonality, treatment setup, regulatory requirements, and design a monitoring and prevention programme built for your situation, not a generic template.
|
95%
ALGAE reduction
|
24/7
real-time monitoring
|
10K+
deployments worldwide
|