

Source water protection is the practice of managing reservoir and intake quality before water reaches the treatment facility. For utilities dealing with harmful algal blooms (HABs), cyanotoxins, and seasonal taste and odor events, it is often one of the most cost-effective approaches available. Prevention at the source reduces how much end-of-pipe treatment has to do.
Every liter of drinking water starts somewhere: typically a reservoir, river intake, or lake. What happens at that source shapes everything downstream: treatment plant load, chemical consumption, operational costs, and whether finished water meets regulatory standards and customer expectations.
This guide covers why source water quality directly affects treatment operations, what the main protection approaches are, the regulatory framework utilities need to manage, and how integrated monitoring and control work in practice.
How Source Water Quality Affects Treatment Plant Performance
Treatment plants are engineered around assumptions about raw water quality. When incoming water carries high algal biomass or significant cyanotoxin loads, those assumptions break down. The disruption can be gradual, or it can happen fast during a bloom event that compresses treatment decisions into hours.
The downstream effects are both operational and financial. Algae entering the intake clog filter media. This reduces filter run times and increases backwash frequency. Organic matter from algal cells raises chlorine demand during disinfection, which increases the formation of disinfection byproducts (DBPs) such as trihalomethanes (THMs) and haloacetic acids (HAAs). Both are regulated under the EPA’s Disinfectants and Disinfection Byproducts Rule. Powdered activated carbon (PAC) demand rises during bloom events. Customer complaints follow.
These costs are individually manageable. The problem is that they cluster during summer, precisely when water demand peaks, staff capacity is stretched, and the pressure to maintain service continuity is highest.
Source water protection distributes that pressure across the full operating season rather than concentrating it in a few weeks of reactive management.
Source Water Protection Approaches: What Utilities Use

No single intervention covers all source water quality challenges. Most effective programs combine several approaches. The main categories are:
1) Watershed and catchment management
Nutrient loading from agricultural runoff, urban stormwater, and failing septic systems drives eutrophication and cyanobacterial growth. Long-term watershed management programs reduce nutrient inputs through buffer zones, best management practices for agriculture, and land-use controls near reservoir catchments.
Watershed management is the most ecologically durable approach. Its limitation is the timeframe. Meaningful reductions in sediment phosphorus accumulation take years or decades. Internal nutrient loading from reservoir sediments can sustain algal growth long after external inputs are controlled. Watershed management is a necessary strategy, but for utilities managing active bloom problems today, it cannot be the only one.
2) Aeration and destratification
Mechanical aeration systems circulate water through the reservoir to disrupt thermal stratification, introduce oxygen to deep layers, and reduce the anoxic conditions that release sediment phosphorus. Destratification can reduce bloom intensity in stratified reservoirs and is a well-established tool in reservoir management.
Its effectiveness depends on reservoir geometry, depth, and stratification patterns. In large or deep reservoirs, full destratification may require significant infrastructure investment. Aeration modifies the conditions that favour blooms rather than targeting algae directly.
3) Selective withdrawal
Intake structures with multiple withdrawal levels allow operators to draw from water layers with the lowest algal biomass or the most favourable water chemistry at any point in the season. Selective withdrawal is a low-cost operational tool that can reduce algal load at the intake without additional chemical intervention.
4) Algaecide treatment
Copper sulfate and other algaecides have been used in source water reservoirs for decades. They reduce algal biomass when applied correctly. Associated costs include chemical procurement, potential effects on non-target organisms, repeated seasonal applications, and the risk of releasing intracellular cyanotoxins when cyanobacterial cells lyse.
5) Ultrasonic algae control
Ultrasonic treatment targets the buoyancy regulation of cyanobacteria directly. Specific frequency programs affect the gas vacuoles that buoyant cyanobacteria use to position themselves near the water surface, where light supports rapid growth. Without that positional advantage, cell proliferation slows substantially. The technology is chemical-free, autonomous, and solar-powered.
Unlike algaecides, ultrasonic treatment does not cause cell lysis. It therefore does not trigger a pulse of released cyanotoxins into the water column. This is a meaningful operational advantage for utilities monitoring finished water for microcystin and cylindrospermopsin compliance.
6) Combining approaches for source water protection
These approaches are not mutually exclusive. Watershed management addresses long-term nutrient reduction. Aeration improves stratification dynamics. Selective withdrawal optimises intake conditions. Ultrasonic control actively manages algal populations at the surface. Utilities with the most resilient source water programs typically layer these tools rather than relying on a single method.
Regulatory Framework: Cyanotoxins in Drinking Water
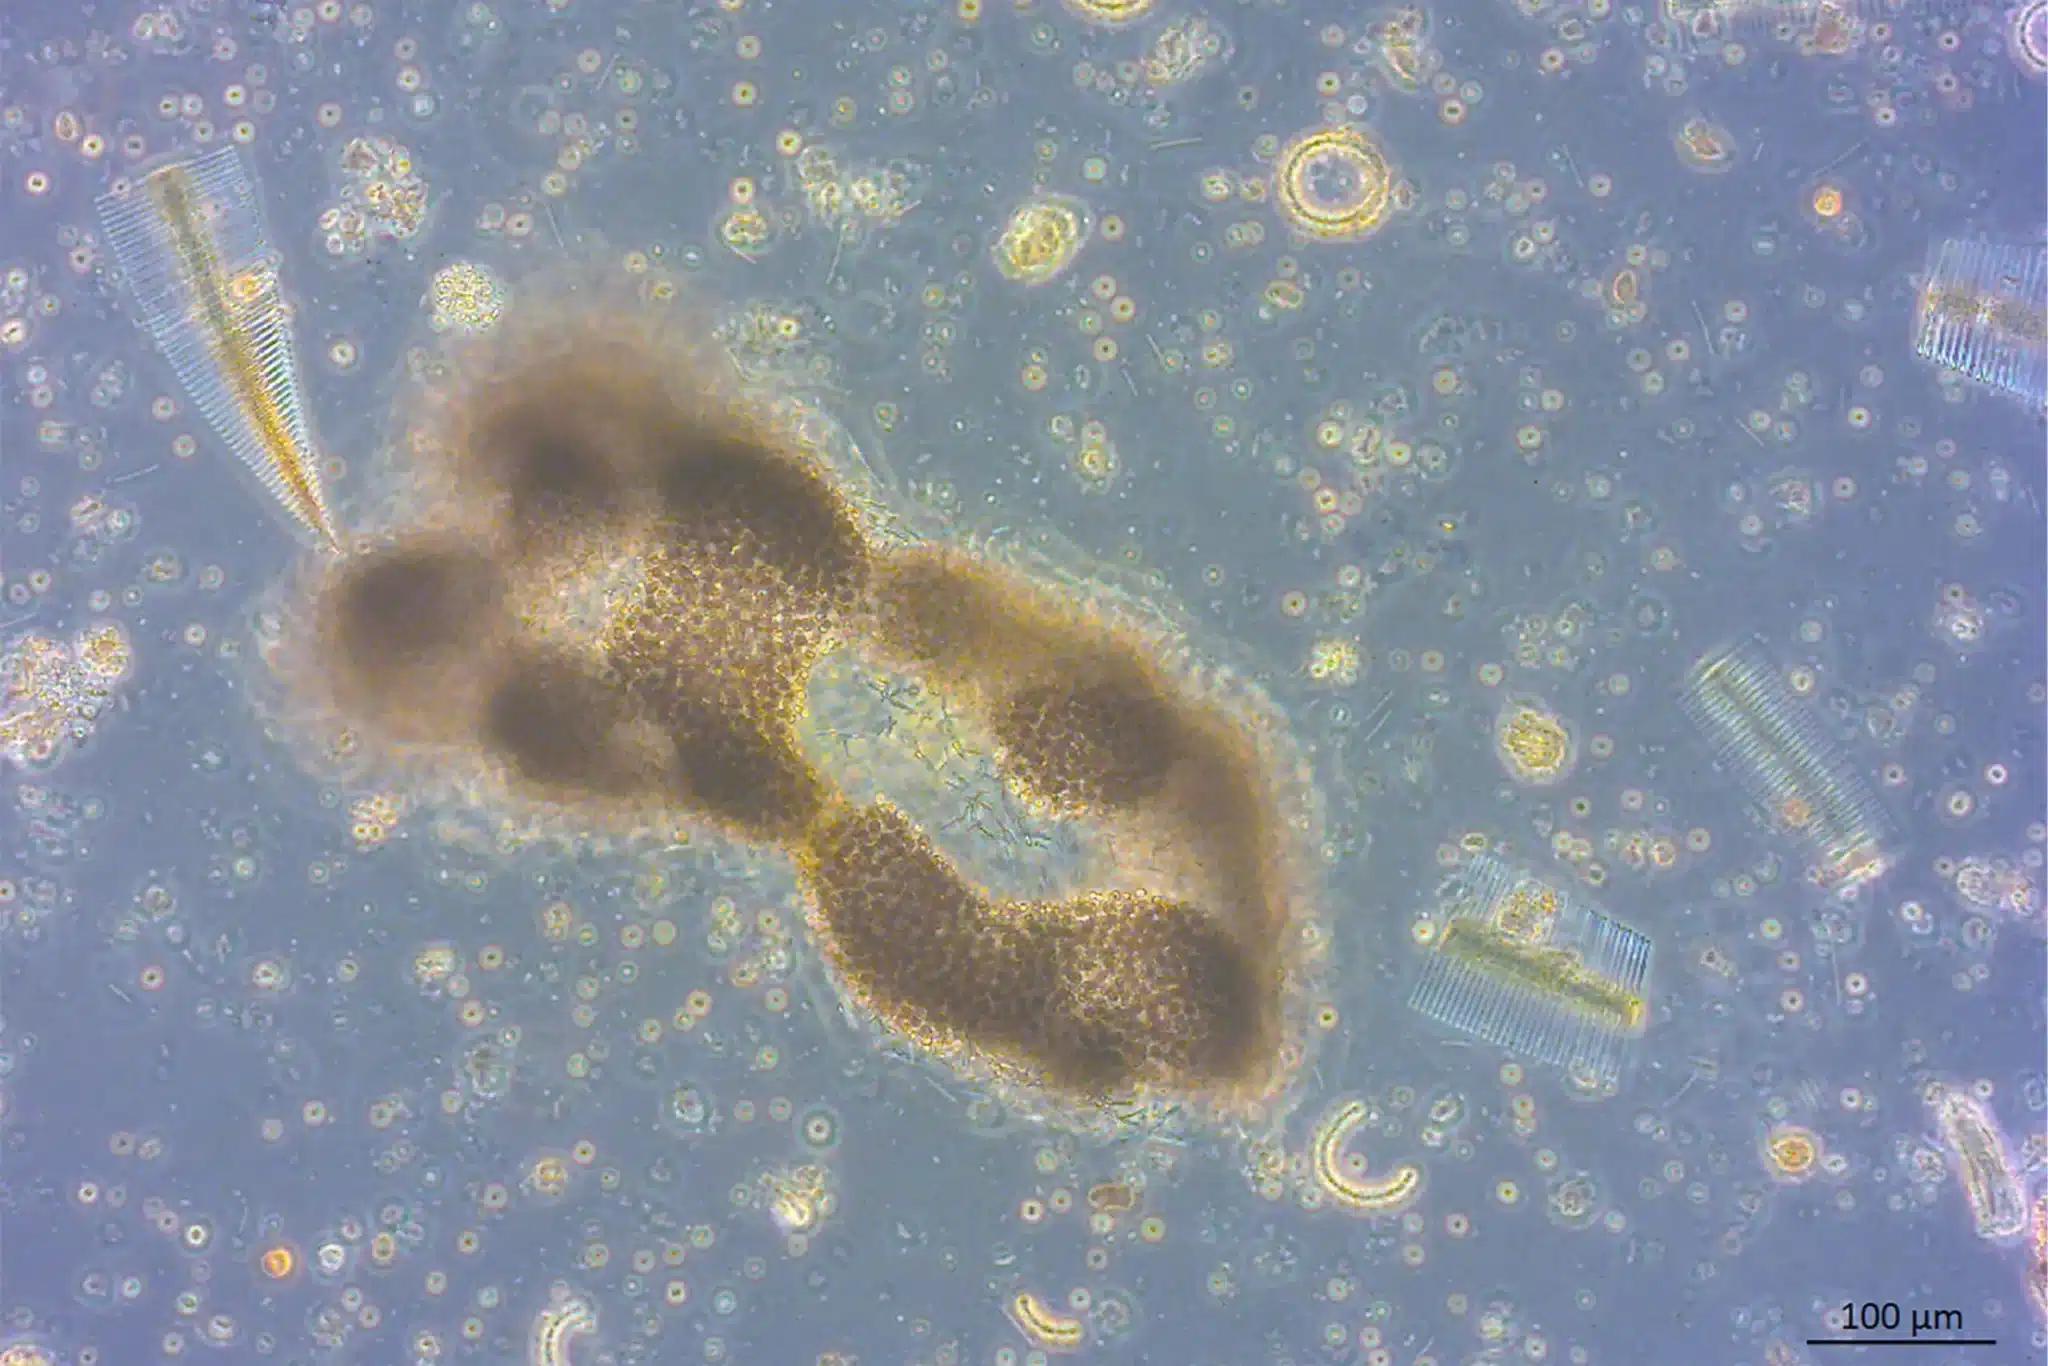
The regulatory framework for cyanotoxins in U.S. drinking water is still developing, but utilities managing HABs already operate within a clear set of reference levels.
The EPA issued 10-day drinking water Health Advisories for microcystins and cylindrospermopsin in 2015. These remain the primary federal reference points:
Cyanotoxin | Children under 6 | School-age children and adults |
Microcystins | 0.3 µg/L | 1.6 µg/L |
Cylindrospermopsin | 0.7 µg/L | 3.0 µg/L |
These are non-enforceable advisory levels rather than regulatory limits. However, they function as practical compliance triggers. Many states have adopted their own standards based on these values. Several now require public notification when cyanotoxin levels are detected in finished water.
Microcystins and cylindrospermopsin were also monitored under the EPA’s Unregulated Contaminant Monitoring Rule 4 (UCMR 4), which collected nationally representative occurrence data from thousands of public water systems between 2018 and 2020. EPA uses this data to inform future regulatory decisions under the Safe Drinking Water Act. Utilities in regions with documented cyanotoxin occurrence should treat current monitoring as baseline-building for a regulatory environment likely to tighten.
Treatment plant implications
Cyanotoxins can pass through conventional treatment when algal loads in source water are high. Granular activated carbon (GAC), advanced oxidation, and UV treatment remove dissolved cyanotoxins effectively. However, reducing the algal load in the reservoir before it reaches the plant is the first line of defence.
Taste and odor compounds, geosmin and MIB, are not regulated. However, they drive customer complaint volumes and shape public perception of water quality. Cyanobacteria and actinomycetes produce them under bloom conditions. Human taste can detect these compounds at concentrations as low as 10 nanograms per litre, well below any health threshold. The reputational cost of tap water that smells of earth or mildew should not be underestimated.
How American Water cut chemical costs by 22% and extended filter run times by 127% through source-level algae control
American Water’s Canoe Brook Water Treatment Plant in Short Hills, New Jersey, faced persistent cyanobacteria and algal bloom challenges that compromised source water quality and increased treatment burden. After deploying MPC-Buoy systems in the reservoir, peer-reviewed research documented an 89% reduction in algae growth, 22% fewer chemicals, and filter run times 127% longer than the prior year. Annual savings reached approximately $87,800, with a return on investment within 1.8 years. The Canoe Brook deployment was the first installation of this technology for drinking water reservoirs in North America.
Continuous Monitoring: The Foundation of Source Water Protection
Source water protection decisions depend on data. When reservoir monitoring relies on periodic grab samples, the information available to guide treatment decisions is always lagging. A bloom that develops between weekly samples may not appear in laboratory data until concentrations are already rising steeply at the intake.
Continuous in-situ monitoring closes that lag. Tracking chlorophyll-a (total algal biomass), phycocyanin (cyanobacteria specifically), dissolved oxygen, temperature, and pH in real time allows operators to observe changing conditions as they develop. They can adjust PAC inventory, backwash scheduling, and chemical orders based on current reservoir conditions rather than last week’s sample results.
Predictive value
Continuous data also supports prediction. Chlorophyll-a trajectories, temperature profiles, and dissolved oxygen patterns are informative about where reservoir conditions are heading. When operators feed these parameters into a predictive model, it can provide advance warning of bloom development days before surface concentrations become problematic. This gives treatment staff time to prepare rather than react.
Results in Practice: Source Water Protection Case Studies
Berthoud, Colorado (USA)
The Town of Berthoud operates a surface water treatment system supplied by a 30-acre reservoir. The reservoir divides into an East Cell, which feeds the treatment plant, and a West Cell. Seasonal algae growth historically drove elevated geosmin and MIB concentrations, higher PAC usage, and variable treatment conditions during peak summer demand.
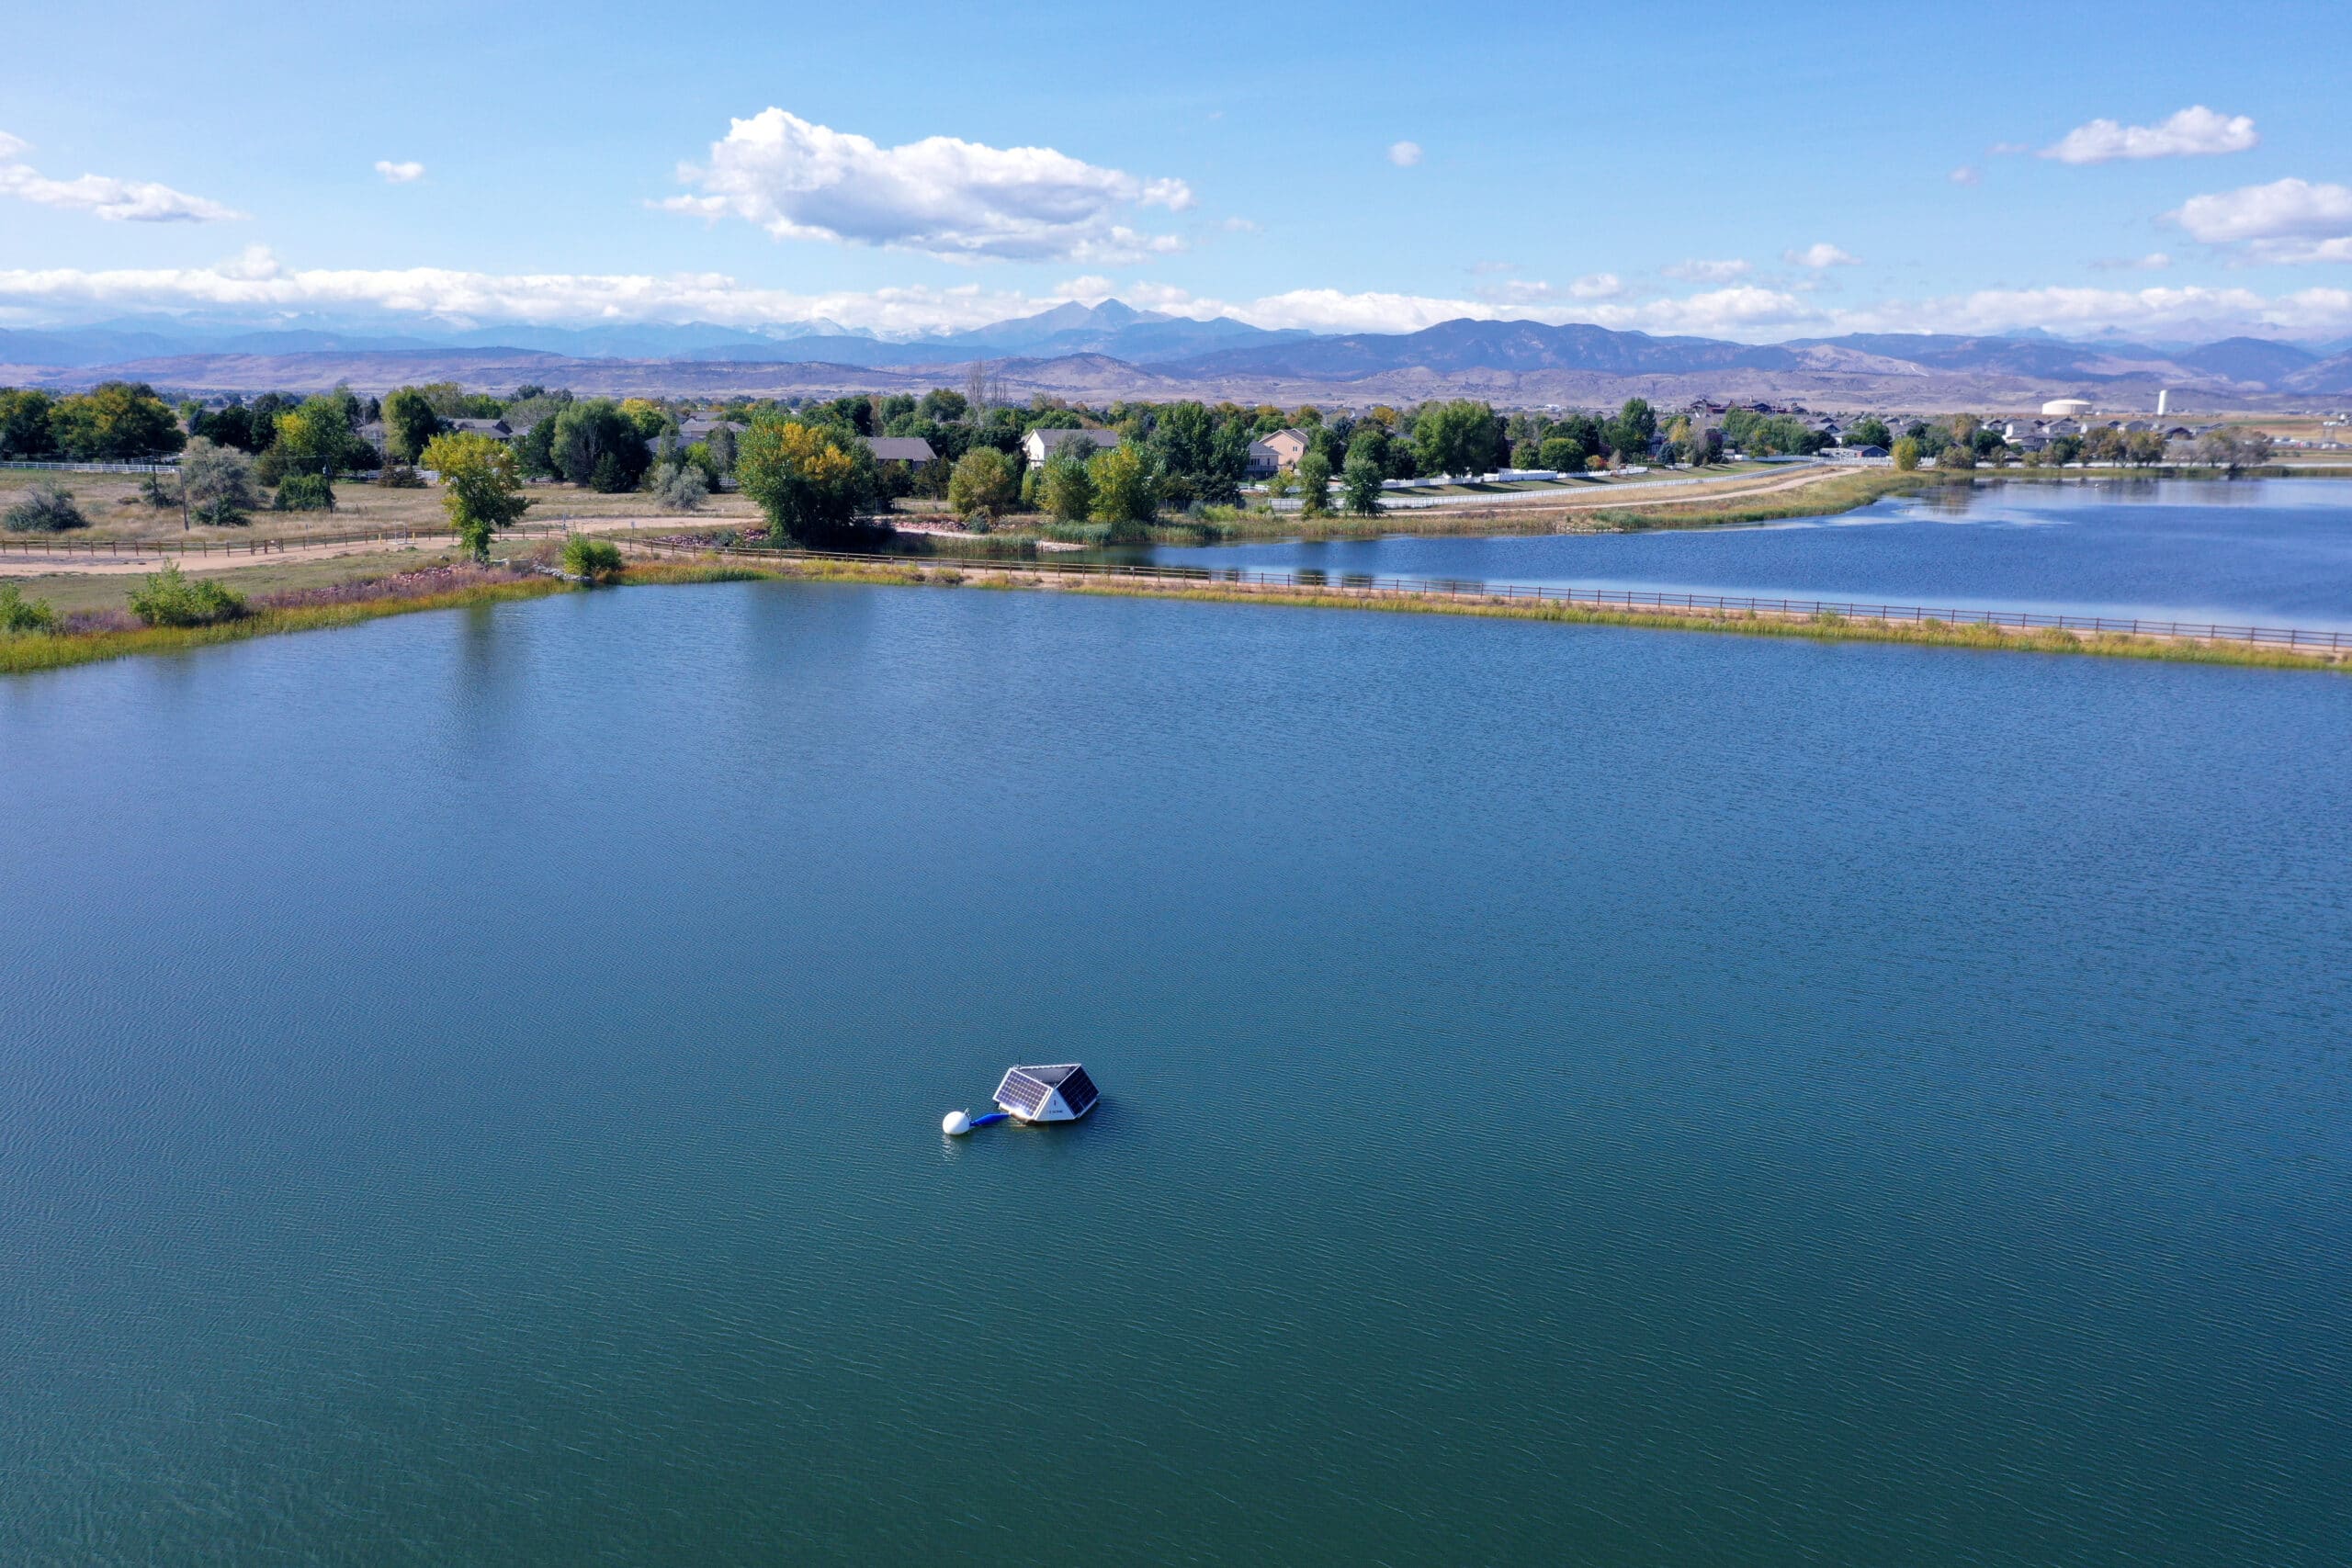
MPC-Buoy LG Sonic algae control device – source water protection at Berthoud Reservoir
Following MPC-Buoy installation in the East Cell, combined with real-time monitoring through MPC-View, the 2025 season showed clear operational improvements. Taste and odor events between July and early September were fewer and less intense than the previous year. Floating algae in the East Cell reduced noticeably when the system was active. PAC dosing followed more predictable seasonal patterns.
In the utility’s own words: “The LG Sonic device has effectively reduced the amount of algae and organic matter entering the Berthoud water treatment plant. The device requires little maintenance, is easy to use, and allows for remote data collection.”
Read the full Berthoud case study
Valdesia Reservoir, Dominican Republic
The Valdesia reservoir covers 7 km² and supplies drinking water to approximately 4 million people in and around Santo Domingo. The Santo Domingo Water and Sewage Corporation (CAASD) deployed multiple MPC-Buoy systems across the reservoir after years of persistent algal bloom contamination.
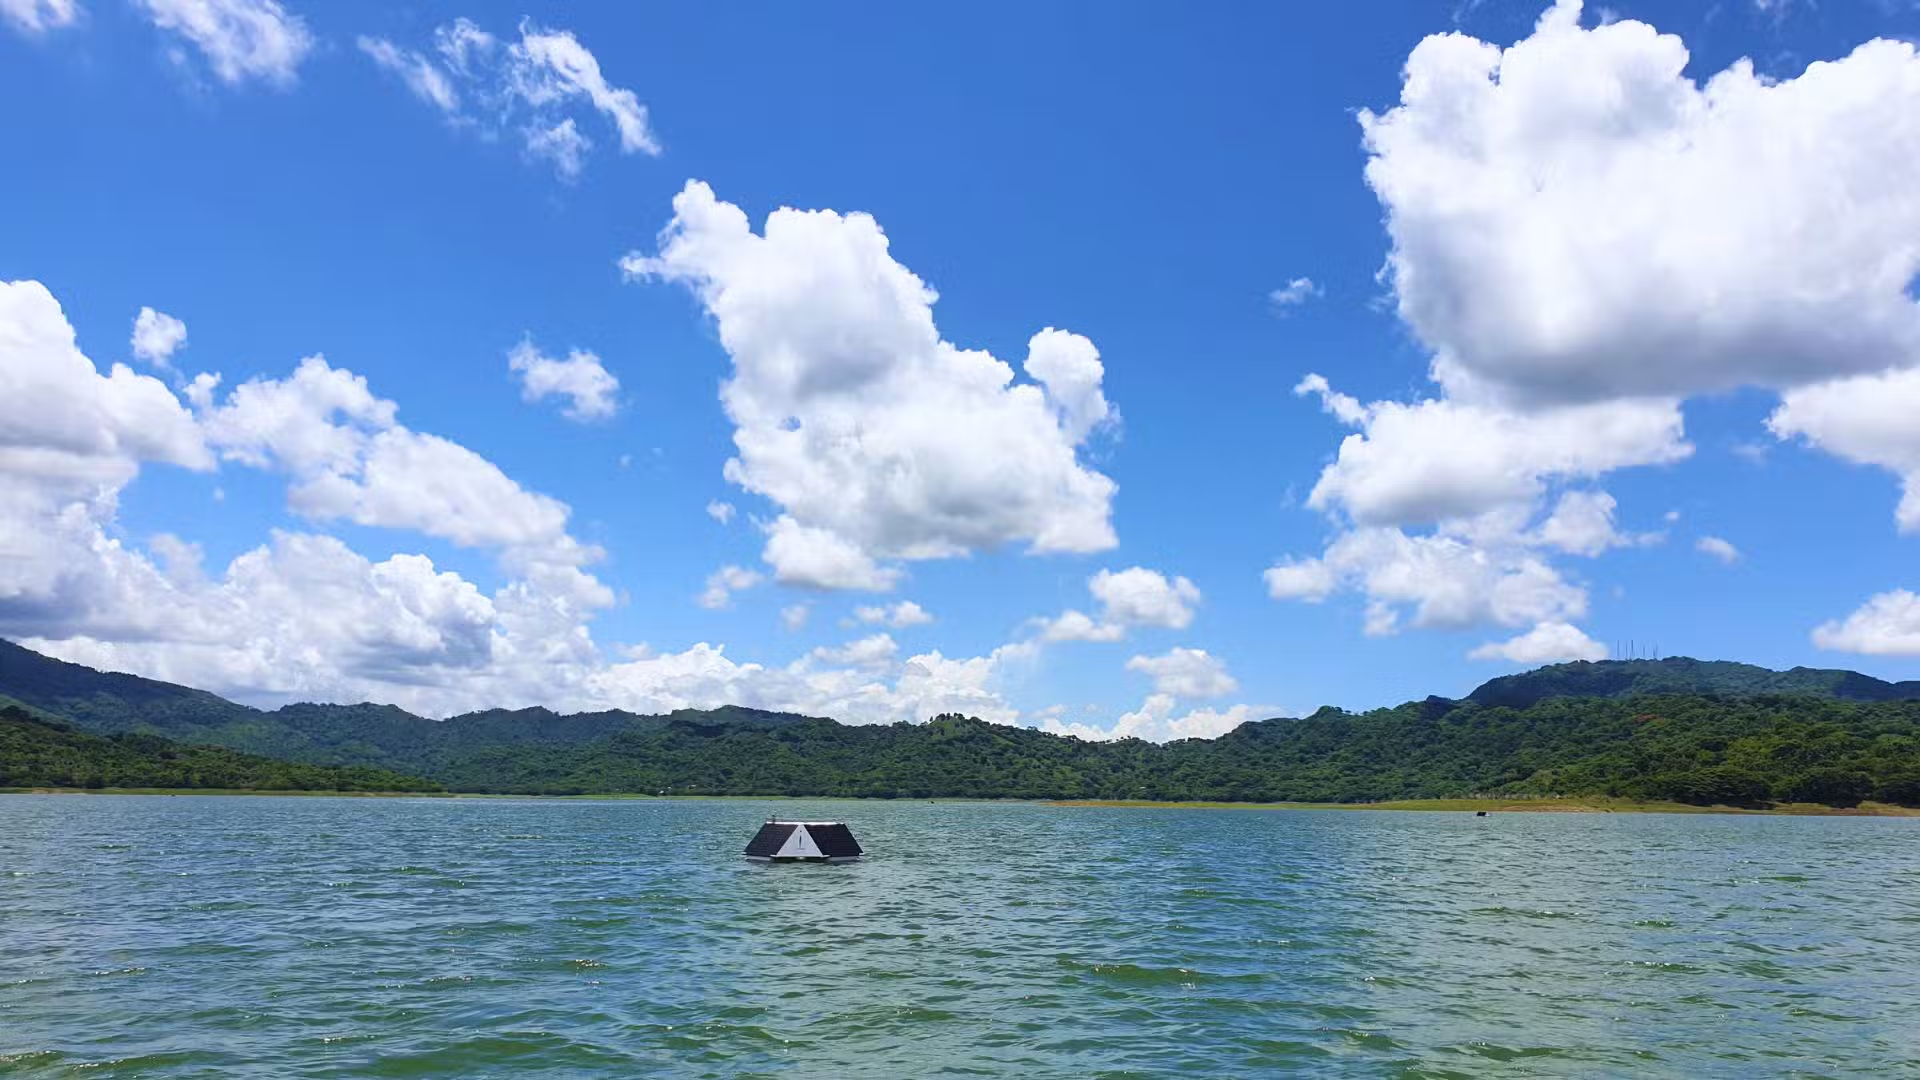
LG Sonic’s MPC-Buoy devices were installed to tackle the drinking water crisis affecting 4 million people in Santo Domingo, Dominican Republic.
Water quality improvements were visible within two to three weeks of installation. Over the first year, the project achieved an 87% reduction in chlorophyll-a levels, exceeding its initial targets.
The Valdesia deployment shows that source water protection scales. Large reservoirs serving major urban populations can apply the same operational logic as smaller municipal systems: reduce algal load before the intake, and the treatment process runs on more predictable inputs.
Read the full Valdesia case study
Implementing Source Water Protection: A Practical Framework

Utilities evaluating a source water protection program typically work through three questions.
What is the current cost of reactive management? PAC consumption during bloom events, filter backwash frequency, additional chemical dosing, staff overtime, and customer complaint volumes all represent quantifiable costs. Establishing a baseline makes the investment case concrete and defensible to finance and procurement. PAC consumption records and filter run logs from the past two to three bloom seasons are a practical starting point.
Where are the monitoring gaps? If treatment decisions rely on grab samples, there is a lag between reservoir conditions and operator knowledge. Identifying the parameters most relevant to local conditions, including chlorophyll-a, phycocyanin, dissolved oxygen, and temperature, helps target where continuous sensors add the most value.
Is the reservoir part of the treatment process? Treatment frameworks tend to focus on what happens after the intake. Treating the reservoir as an active, manageable stage of the treatment process changes how resources are allocated and where problems are solved. Utilities that make this shift distribute the management burden more evenly across the full season.
The right combination of tools depends on reservoir size, stratification behaviour, local nutrient dynamics, bloom species, and plant configuration. LG Sonic supports utilities through that assessment process, from reservoir characterisation to monitoring system design to MPC-Buoy deployment, across more than 60 countries.
Key Takeaways
- Source water protection manages water quality at the reservoir before it reaches the treatment facility, often reducing treatment cost and operational variability.
- Multiple approaches exist: watershed management, aeration, selective withdrawal, algaecide treatment, and ultrasonic control. Effective programs combine methods rather than relying on a single tool.
- EPA Health Advisories set reference levels for microcystins (0.3 µg/L for young children) and cylindrospermopsin (0.7 µg/L for young children). Several states have implemented their own standards. The regulatory environment is likely to tighten as UCMR 4 data informs future rulemaking.
- Continuous in-situ monitoring provides the real-time data that makes proactive decisions possible. Grab sampling alone creates information lags that limit treatment response.
- Peer-reviewed results at American Water’s Canoe Brook reservoir showed 89% algae reduction, 22% fewer chemicals, and 127% longer filter run times. Similar programs at Berthoud (Colorado) and the Valdesia reservoir (Dominican Republic) demonstrate consistent operational benefits at different scales.
- Utilities building the business case for source water investment can start with existing records: PAC consumption logs and filter run data from the past two to three bloom seasons provide a measurable baseline.
To explore how LG Sonic supports source water management for drinking water utilities, visit the Drinking Water Reservoirs application page or the MPC-Buoy product page.
Trusted by water utilities, irrigation operators, and industrial water managers in 60+ countries
Curious whether ultrasonic control fits your reservoir?
Every treatment plant has a different source water profile, algae history, and operational constraints. Our water quality engineers review your specific site conditions, source water data, basin configuration, treatment setup, and regulatory requirements, then design a monitoring and control programme built for your plant, not a generic template.
|
up to 90%
chlorophyll-a reduction
|
24/7
real-time monitoring
|
10K+
deployments worldwide
|