


Summary
Complete guide for water utilities managing harmful algal blooms in drinking water reservoirs. Learn bloom development stages, monitoring strategies (grab sampling vs. continuous), chemical-free prevention methods, and operational impacts including taste/odor complaints and treatment disruptions. Includes real utility case studies and actionable framework for immediate response and strategic planning. Designed for utilities, reservoir managers, and operators maintaining drinking water quality under regulatory constraints.
Harmful algal blooms create growing challenges for water utilities worldwide, disrupting treatment operations, driving up costs, and increasing pressure on utilities to maintain consistent water quality under changing conditions.
Many drinking water utilities rely on surface water sources that are increasingly affected by harmful algal blooms, making proactive management strategies essential for maintaining treatment stability and regulatory compliance.
This guide focuses specifically on how harmful algal blooms impact drinking water utilities and how operators can manage them. For a general overview of cyanobacterial blooms, including causes and environmental impacts, see our cyanobacterial blooms overview.
This guide is designed for water utilities, reservoir managers, and operators responsible for maintaining drinking water quality under regulatory and operational constraints. You’ll learn how blooms develop, how to detect them early, and which prevention strategies deliver measurable results for utilities facing similar challenges.
What Harmful Algal Blooms Mean for Drinking Water Utilities
Harmful algal blooms present unique challenges for drinking water utilities that differ fundamentally from aesthetic algae problems in recreational lakes. While recreational water bodies primarily face visual and odor issues, drinking water systems must protect against toxin contamination, maintain regulatory compliance, manage customer perception, and prevent operational disruptions—all while keeping treatment costs predictable.
Unlike general algae growth, harmful blooms produce cyanotoxins that conventional treatment processes may not remove effectively. These toxins can persist in treated water if dissolved cyanotoxins are not adequately removed or destroyed. Additionally, the compounds responsible for taste and odor—geosmin and 2-methylisoborneol (MIB)—appear at concentrations customers detect long before toxins reach concerning levels. This creates communication challenges when water meets all health standards but customers refuse to drink it.
The operational distinction matters because it determines response strategy. Recreational lake managers can close access during blooms. Drinking water utilities must maintain continuous service while managing multiple risk factors simultaneously: source water contamination, treatment plant performance, customer complaints, regulatory reporting, and public health protection.
Many of these challenges are directly linked to broader reservoir water quality management strategies. These include nutrient control, stratification management, and intake optimization that prevent conditions favoring bloom development.
HABs in Drinking Water Systems: What Operators Need to Know
Harmful algal blooms occur when cyanobacteria—often called blue-green algae despite being bacteria, not algae—grow rapidly enough to form dense accumulations that threaten water quality. These organisms produce toxins, taste and odor compounds, or both. This distinguishes them from nuisance algae that only affect aesthetics.
Common bloom-forming species in drinking water reservoirs include Microcystis, which forms thick surface scums and produces microcystin toxins affecting liver function. Anabaena thrives in stratified reservoirs and produces both anatoxins affecting the nervous system and taste and odor compounds. Some Cylindrospermopsis species grow well in warmer water and can produce cylindrospermopsin, which conventional treatment removes less effectively than other cyanotoxins. Some Aphanizomenon species can produce saxitoxins that affect nerve function, though this occurs less frequently in freshwater drinking water sources.
Cyanotoxins of concern for drinking water utilities vary in their health effects and treatment requirements. Microcystin damages liver cells with repeated exposure. It is the most commonly detected cyanotoxin in North American drinking water sources. The EPA established a health advisory level of 1.6 µg/L for adults and 0.3 µg/L for bottle-fed infants and young children.
Cylindrospermopsin is associated with liver and kidney toxicity and can persist longer in water than microcystin. Anatoxin-a acts rapidly on the nervous system and requires different treatment approaches than hepatotoxins. Saxitoxins block nerve signals and, while rare in drinking water, require immediate response when detected.
Visual identification helps utilities recognize developing blooms before laboratory confirmation arrives. Blooms typically appear as bright green water, surface scums resembling spilled paint, or floating streaks and clumps. Water may smell earthy or musty before blooms become visible. Some blooms appear blue-green, while others look brownish or reddish, depending on the dominant species.
Our visual identification guide provides detailed images for recognizing different bloom types. The CDC also offers identification resources for distinguishing harmful blooms from non-toxic algae.
The distinction between aesthetic algae and harmful cyanobacteria matters for response planning. Green algae and diatoms may cloud water or grow on filters, but rarely produce toxins. Cyanobacteria blooms require toxin testing, public notification, and potentially treatment modifications—even when visual appearance seems similar to non-toxic algae. Understanding algae-associated illnesses helps utilities recognize when blooms pose genuine health risks versus aesthetic concerns.
How Harmful Algal Blooms Develop in Reservoirs
Understanding bloom development helps utilities identify when intervention opportunities exist and which monitoring parameters matter most for early warning.
Stage 1: Nutrient accumulation
Creates the foundation for potential blooms. Phosphorus and nitrogen enter reservoirs from agricultural runoff, urban stormwater, wastewater discharges, and atmospheric deposition. These nutrients accumulate in water and sediments. They establish conditions that can support rapid algae growth when other factors align favorably.
Stage 2: Thermal stratification
Separates reservoirs into distinct layers as surface water warms. The upper layer (epilimnion) becomes warmer and lighter, while deeper water (hypolimnion) remains cooler and denser. A sharp temperature gradient (thermocline) forms between layers, preventing mixing. This stratification traps nutrients in surface waters where light penetrates. It creates ideal conditions for photosynthetic organisms, including cyanobacteria.
Stage 3: Rapid cyanobacteria growth
Begins when water temperatures rise above approximately 20°C (68°F) and nutrients are available in surface waters. Cyanobacteria have competitive advantages over other algae in these conditions. They can regulate their position in the water column using gas vesicles. Cyanobacteria tolerate low nitrogen conditions by fixing atmospheric nitrogen. They thrive in stable, stratified environments. Population doubling times can be as short as 1-3 days under optimal conditions.
Stage 4: Surface accumulation and visible bloom formation
Occurs as cyanobacteria populations reach densities of 20,000-100,000 cells per milliliter or higher. Buoyant species rise to the surface, forming visible scums, streaks, or discolored patches. Wind and currents concentrate these accumulations along shorelines or near intake structures. At this stage, blooms become obvious to operators and potentially to the public.
Stage 5: Toxin production and release
Happens throughout the bloom lifecycle, though concentrations vary by species, environmental stress, and growth phase. Some cyanobacteria produce toxins continuously as they grow. Others release higher concentrations when stressed or dying. Taste and odor compounds (geosmin and MIB) are also released during this stage. They often trigger customer complaints before toxin levels reach concerning concentrations.
Stage 6: Cell death and maximum toxin release
Occurs as blooms age, nutrients become depleted, or conditions change. Dying cells release all contained toxins into the water. This is why chemical treatments that rapidly kill algae—such as copper sulfate—create temporary spikes in toxin concentrations that can exceed levels present during active blooms. Natural bloom senescence releases toxins more gradually. However, dissolved toxins can persist in water for weeks to months, depending on temperature, sunlight, and microbial degradation rates.
For utilities, the critical intervention window occurs before visible bloom formation, when monitoring data can still support prevention actions before treatment disruption or customer complaints occur.
Understanding this six-stage progression reveals intervention opportunities at each phase. The most cost-effective window occurs before visible bloom formation, when early monitoring data can still inform prevention actions.

Understanding bloom progression helps utilities identify the critical intervention window before surface blooms form.
Want to act before Stage 4, before the bloom becomes visible?
The intervention window described above requires continuous monitoring data: chlorophyll-a, phycocyanin, dissolved oxygen, temperature, and nutrient levels tracked in real time. The MPC-Buoy provides all six parameters from a single deployed unit — giving your team the early warning data to intervene at Stage 2 or 3, not Stage 5 or 6.
Why Harmful Algal Blooms Are Intensifying
Multiple interconnected factors explain why utilities face more frequent, longer-lasting, and more intense blooms than in previous decades. Understanding these drivers helps utilities target prevention efforts where they’ll deliver measurable impact.
Nutrient Loading from Upstream Sources
Nutrient loading from upstream sources creates the foundation for bloom development. Agricultural runoff carries nitrogen and phosphorus from fertilized fields directly into reservoirs. Urban stormwater adds nutrients from lawn care, failing septic systems, and pet waste. Wastewater treatment plants contribute nutrients even when meeting discharge permits. This is particularly true in watersheds with multiple facilities discharging to the same water body.
These sources combine to create nutrient concentrations that favor bloom-forming cyanobacteria over other phytoplankton. Our comprehensive guide on nutrient pollution explains how these sources interact to create bloom-favorable conditions. The EPA Nutrient Pollution resources detail management strategies that utilities can pursue with agricultural and municipal partners.
Internal Phosphorus Cycling
Internal phosphorus cycling sustains blooms even after watershed improvements reduce external inputs. When reservoir bottom waters lose oxygen during thermal stratification, phosphorus stored in sediments dissolves back into the water column. Research shows this internal loading can fuel blooms for a decade or longer after upstream nutrient reduction begins. Duration depends on sediment phosphorus content and reservoir mixing patterns.
Dissolved oxygen levels typically below 2 mg/L in bottom waters trigger phosphorus release. However, specific thresholds vary by sediment chemistry and water temperature. Utilities with deep reservoirs that stratify strongly during summer months face particularly persistent challenges from this mechanism. Learn more about managing eutrophication in drinking water reservoirs to address both external and internal nutrient sources.
Climate Patterns and Temperature Changes
Climate patterns and water temperature changes extend bloom seasons beyond traditional summer months in many regions. Water temperatures above 20°C (68°F) generally favor rapid cyanobacteria growth. Warming patterns now push these conditions earlier into spring and later into fall across much of North America, Europe, and other temperate regions.
Some utilities that previously monitored June through August now face potential blooms from April through November in some years. This increases both monitoring costs and bloom probability. The NOAA Harmful Algal Bloom Forecasting System tracks seasonal patterns. It provides regional outlook data that utilities can refer when planning monitoring programs.
These drivers combine to create conditions where blooms develop faster, grow larger, and persist longer than historical baselines indicate. The economic impact of algae blooms extends beyond immediate treatment costs. It includes lost revenue from reduced water sales, customer complaint management, and long-term reputation effects that utilities must factor into risk assessments.
How Harmful Algal Blooms Impact Water Utilities’ Operations
Harmful algal blooms create cascading operational challenges that extend well beyond the immediate bloom event and affect multiple aspects of utility operations.

Harmful algal blooms in Lake Okeechobee
1) Taste and Odor Complaints
Taste and odor complaints drive most utility responses to harmful algal blooms and create customer perception challenges that persist even after blooms subside. Cyanobacteria produce geosmin and 2-methylisoborneol (MIB)—compounds that cause earthy, musty flavors. Customers can detect these at extremely low concentrations. Research shows human sensory thresholds for these compounds can be as low as 4-10 parts per trillion, depending on individual sensitivity.
A developing bloom can generate dozens of complaints within 24-48 hours as compound concentrations rise. This overwhelms call centers and creates public concern that water safety has been compromised. The American Water Works Association (AWWA) provides protocols for managing customer communications during these events. They emphasize that taste and odor problems don’t necessarily indicate toxicity.
Many customers assume any change in water taste or smell signals contamination. This creates communication challenges that damage trust even when water meets all health standards. For detailed strategies on preventing and managing these issues, see our guide on taste and odor in drinking water.
CEDAE in Rio de Janeiro, Brazil faced persistent geosmin and MIB problems that generated thousands of customer complaints during bloom season. After implementing chemical-free source water management, they eliminated taste and odor episodes. They achieved this without the operational disruptions or toxin release risks associated with traditional approaches.
2) Treatment Plant Disruptions
Treatment plant disruptions strain operations and force unplanned budget expenditures. Standard clarification and filtration remove intact algae cells but not dissolved cyanotoxins or taste and odor compounds already released into the water. Filter performance degrades as dense algae accumulations clog the media. Run times that normally extend several days may drop to hours. This forces frequent backwashing that wastes treated water and requires constant operator attention.
The City of Archie, Missouri experienced exactly this challenge when recurring blooms disrupted their municipal drinking water operations through persistent filter clogging. After implementing source water algae control, they restored normal filter cycles. They eliminated the operational unpredictability that characterized previous bloom seasons.
3) Regulatory Compliance Requirements
Regulatory compliance and monitoring requirements intensify during bloom events. While EPA has not yet established enforceable Maximum Contaminant Levels for cyanotoxins under the Safe Drinking Water Act, the agency issued health advisory levels that many states have incorporated into monitoring and notification requirements.
Utilities must conduct frequent toxin testing during blooms. Laboratory analysis costs typically range from $200-400 per sample, depending on the specific toxins analyzed and analytical methods required. Some states mandate weekly or even more frequent testing when blooms persist. Elevated toxin concentrations trigger mandatory public notification requirements. This generates media attention and customer concern that extends beyond the immediate bloom event.
4) Customer Confidence Challenges
Long-term customer confidence erosion may be the most damaging impact. After experiencing visible blooms, taste and odor problems, or public health advisories, customers question water safety. This occurs even when utilities demonstrate compliance with all applicable standards. This skepticism makes it harder to communicate about unrelated water quality issues. It can undermine support for necessary rate increases or infrastructure investments.
In practice, harmful algal blooms affect utilities through three main pressures: customer complaints triggering communication challenges, treatment disruptions straining budgets and operations, and regulatory monitoring requirements intensifying compliance workload.
Are blooms costing your utility in treatment chemicals, customer complaints, and regulatory reporting?
Each of the operational impacts described above, increased PAC dosing, geosmin complaints, toxin testing, and public health reporting, represents a direct cost line. The New York State DEC deployed MPC-Buoys across multiple water bodies specifically to reduce reactive treatment costs and meet proactive monitoring requirements before bloom events triggered operational disruption.
Early Detection and Monitoring Strategies
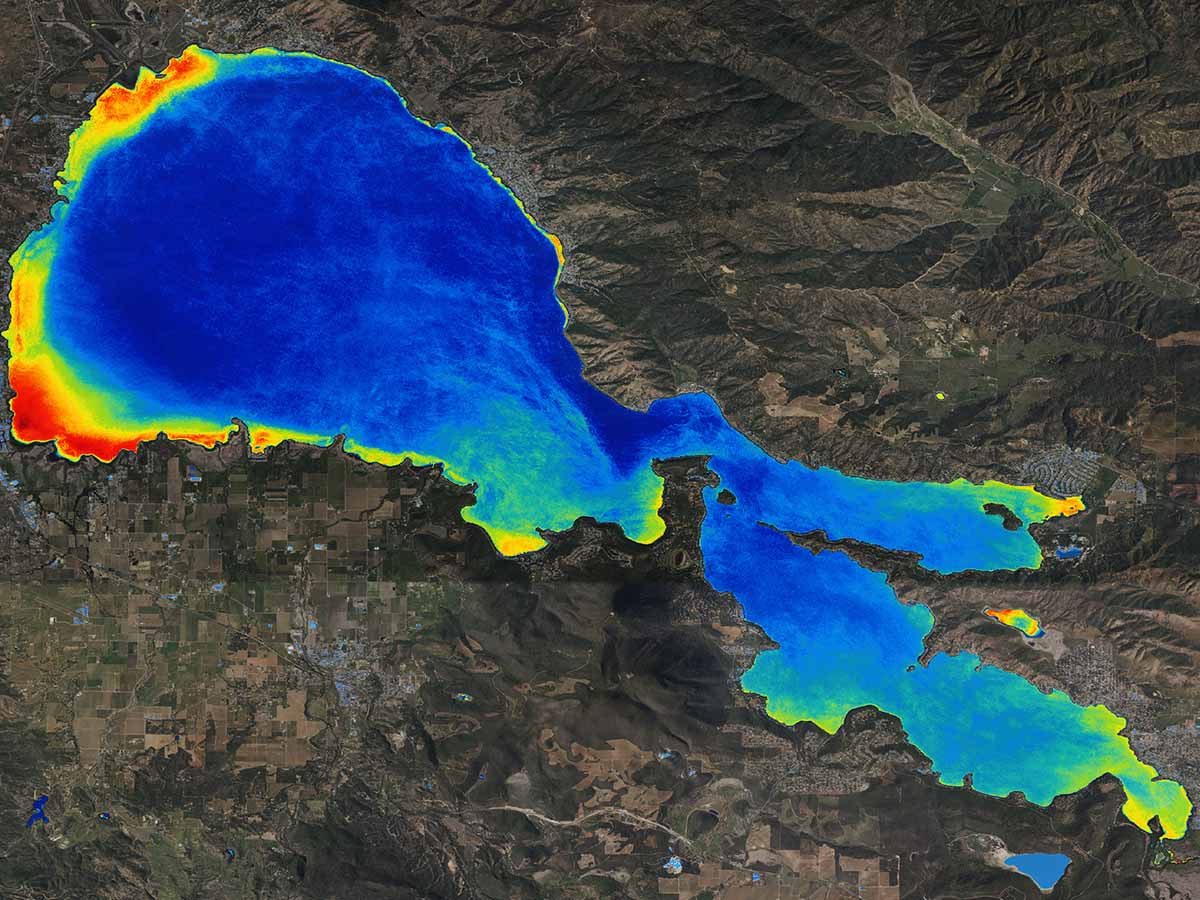
Early detection allows utilities to intervene before blooms reach treatment plants or customers notice problems. Some utilities are also exploring satellite-based monitoring to complement in-situ measurements, particularly for large or remote reservoirs. The operational and financial difference between early warning and reactive crisis management often determines whether a utility prevents customer complaints or manages widespread concern about water safety. Establishing a structured monitoring and response program ensures utilities can move from reactive sampling to proactive risk management.
Essential Monitoring Parameters
Essential parameters for tracking bloom development include chlorophyll-a concentration, phycocyanin fluorescence, dissolved oxygen profiles, water temperature stratification, and key nutrient concentrations. Chlorophyll-a measurements indicate total algae biomass. Concentrations above 10 µg/L generally warrant increased surveillance. Phycocyanin specifically detects cyanobacteria presence. It provides more targeted early warning than chlorophyll-a alone. Concentrations above 5 µg/L typically signal cyanobacteria dominance in the phytoplankton community.
Dissolved oxygen profiles reveal bottom water conditions that trigger internal phosphorus release. Levels below 2 mg/L indicate high risk for nutrient recycling from sediments. Temperature profiles indicate stratification strength and duration, which influence nutrient availability and bloom intensity. The EPA Monitoring and Responding to Cyanobacteria guide details recommended parameters and monitoring frequencies based on bloom risk assessment.
Choosing Your Monitoring Approach
Monitoring approach selection represents a critical decision with significant operational implications. Traditional grab sampling at weekly or biweekly intervals provides periodic snapshots. However, it can miss rapid bloom development between sampling dates. Under favorable conditions, cyanobacteria populations can double every few days. This means blooms can intensify substantially between sampling events.
Real-time monitoring systems that measure key parameters continuously typically detect developing blooms earlier than grab sampling programs. This creates an opportunity for prevention interventions rather than emergency responses. The Virginia Department of Health HAB Toolkit outlines implementation considerations for different monitoring approaches. It bases recommendations on utility size, bloom frequency, and available resources.
Key takeaway for utilities:
- Weekly sampling = reactive response after blooms develop
- Continuous monitoring = early warning while intervention is still possible
- Early warning = prevention window before customer impact
Modern continuous monitoring solutions include buoy-based systems that measure multiple parameters simultaneously. They transmit data to utility SCADA systems or cloud platforms for remote access. These systems provide the real-time data that enables proactive response rather than reactive crisis management. For utilities tracking nutrient dynamics specifically, continuous phosphate monitoring helps identify conditions favoring bloom development before algae populations explode.
The Town of Berthoud, Colorado successfully improved their source water quality through proactive monitoring and management. This demonstrates that early intervention at the reservoir level prevents downstream treatment complications and customer complaints.
Setting Response Thresholds
Response thresholds and action levels should be established during planning periods rather than during crisis response. Pressure for quick decisions during emergencies may lead to suboptimal choices. The Ohio EPA Public Water System Harmful Algal Bloom Response Strategy provides a widely-referenced tiered response framework that many utilities have adapted.
Typical frameworks include surveillance thresholds triggering increased monitoring frequency. They include action thresholds triggering treatment modifications or enhanced surveillance. They also include public notification thresholds triggering customer communication. Cell count thresholds above 20,000 cells/mL for bloom-forming cyanobacteria typically warrant enhanced response. However, appropriate thresholds depend on species dominance, toxin-producing capability, and historical bloom patterns in each system.
The choice between grab sampling and continuous monitoring ultimately determines whether utilities react to blooms or prevent them. Early warning creates the intervention window that separates crisis management from strategic prevention.
Harmful Algal Blooms at Water Utilities: Prevention and Management
Utilities manage harmful algal blooms through three fundamental approaches: preventing blooms at the source, reducing long-term nutrient inputs, or responding at the treatment plant. Source water prevention delivers the best outcomes. It stops blooms before they develop—avoiding toxin release, customer complaints, and emergency treatment costs entirely.
Our guide on how to prevent algal blooms provides comprehensive prevention strategies across multiple intervention points.
Source Water Management
Strategic intake management allows utilities with multiple withdrawal points to draw from depths or locations with lower algae concentrations during bloom events. Deeper water often remains cooler and less affected by surface blooms. However, this depends on reservoir stratification patterns and bloom species characteristics. Some utilities can alternate between sources or blend water from multiple intakes to dilute bloom impacts. This tactical approach requires no chemical treatment but remains limited to systems with infrastructure flexibility.
Watershed nutrient reduction delivers long-term sustainable results but requires multi-year commitment and partnerships beyond utility control. Implementing agricultural best management practices, upgrading wastewater treatment, managing stormwater, and reducing nonpoint source pollution all reduce external nutrient loading that fuels blooms. The EPA Nutrient Management guidance outlines collaborative frameworks that utilities can pursue. Results typically emerge gradually over multiple years.
Chemical-free prevention methods have gained adoption among utilities seeking to prevent blooms without triggering toxin release. Ultrasonic technology disrupts cyanobacteria growth by preventing cells from maintaining their position in the water column. This limits access to sunlight required for photosynthesis. This approach allows utilities to intervene early in the bloom development cycle—during stages 2 and 3, before visible accumulation occurs. It avoids the sudden cell death and toxin release that chemical treatments cause.
Methods like real-time monitoring combined with ultrasonic control allow utilities to intervene before conditions deteriorate to crisis levels. Systems that integrate monitoring with prevention capabilities enable utilities to upgrade from observation-only approaches to complete source water management platforms. These address bloom formation proactively. Learn more about how ultrasonic algae control works in drinking water applications and why utilities are choosing chemical-free approaches.
Vallecitos Water District in California documented operational improvements and cost savings after implementing proactive source water management. This demonstrates measurable return on investment compared to continued reactive approaches.
Treatment Plant Response
When source water prevention isn’t sufficient, utilities must respond at the treatment plant. Treatment plant responses include powdered activated carbon for taste and odor control, ozone or advanced oxidation for toxin destruction, and, in emergencies, chemical algaecides. However, these release toxins immediately upon killing algae cells. They often temporarily worsen water quality before improvement occurs.
Treatment plant responses serve as a necessary backup, but address symptoms after blooms have already developed and impacted operations. They do not prevent bloom formation. This is why utilities increasingly evaluate source water management as their primary HAB strategy. Treatment plant capabilities are maintained as backup for conditions that exceed the prevention system capacity.
How Anglian Water moved from reactive bloom management to continuous source-level monitoring and prevention
Alton Water reservoir serves 92,000+ properties under UK drinking water regulations. Seasonal cyanobacterial blooms were pushing treatment operations to their limits and increasing activated carbon spend each summer. LG Sonic’s MPC-Buoy gave operators continuous early-warning data and suppressed bloom development at the source, reducing treatment disruption and keeping microcystin levels below guideline thresholds through the full bloom season.
Action Framework: Immediate Response and Strategic Planning
Utilities strengthen their approach to harmful algal bloom management through systematic capability building. This addresses both immediate response needs and long-term prevention strategies. This framework distinguishes between actions utilities can implement within current operational constraints and strategic investments requiring budget cycles and planning processes.
Immediate Response Readiness (This Bloom Season)
Review and prepare with existing resources:
- Compile the past 3-5 years of water quality data, customer complaints, and summer treatment cost variations to establish baseline bloom patterns
- Identify which months historically show elevated chlorophyll-a, cyanobacteria counts, or taste and odor complaints
- Document which species appear most frequently in your system and whether they produce toxins, taste and odor compounds, or both
- Verify your current monitoring provides adequate early warning. Assess whether increased sampling frequency during high-risk months would improve detection
- Review and update response protocols. Ensure staff know decision triggers and have the authority to implement responses outside normal business hours
- Prepare customer communication templates in advance rather than drafting messages during crisis response, when time pressure reduces message quality
- Confirm state regulatory reporting requirements and notification triggers so compliance obligations are clear before blooms develop
- Test communication protocols during low-risk periods to identify gaps in decision authority, after-hours response, or stakeholder notification chains
These actions require primarily staff time and internal coordination rather than significant budget allocation. This makes them achievable within current operating year constraints.
Strategic Prevention Planning (6-18 Month Horizon)
Evaluate and implement systematic improvements:
- Assess whether current monitoring approaches detect blooms early enough for intervention. Determine whether continuous monitoring would provide meaningful additional lead time for your system
- Consider upgrading monitoring capabilities to integrated systems that combine real-time data collection with prevention capabilities. Move from reactive observation to proactive management
- Evaluate source water management approaches appropriate to your reservoir configuration, access limitations, and bloom patterns
- Build watershed partnerships with agricultural operators, wastewater utilities, and stormwater managers. Recognize that nutrient reduction results require a sustained multi-year effort
- Develop capital budget proposals for prevention investments. Emphasize avoided costs from reduced emergency treatment, decreased customer complaints, and operational stability benefits
- Conduct a cost-benefit analysis comparing the prevention system installation against the projected ongoing costs of reactive approaches during recurring bloom seasons
Strategic planning recognizes that meaningful improvements in HAB management typically require capital investment and multi-year implementation timelines. Utilities benefit from initiating these planning processes before crisis events create pressure for hasty decisions that may not represent optimal long-term solutions.
The AWWA HAB Resources include planning templates and case examples that utilities can reference when building business cases for HAB management improvements. The California HAB Monitoring and Response Guidelines provide frameworks that many utilities have adapted to their specific regulatory and operational circumstances.
Frequently Asked Questions
What causes harmful algal blooms in drinking water reservoirs?
Harmful algal blooms result from the combination of warm water temperatures (generally above 20°C or 68°F), elevated nutrient concentrations (particularly phosphorus and nitrogen), and stable water conditions with limited mixing. Nutrients enter reservoirs from agricultural runoff, urban stormwater, wastewater discharges, and internal recycling from sediments when bottom waters lose oxygen. Climate patterns that extend warm weather periods and increase stratification intensity contribute to more frequent and longer-lasting blooms.
How do water utilities detect harmful algal blooms early?
Utilities detect developing blooms through monitoring programs that track chlorophyll-a (total algae), phycocyanin (cyanobacteria-specific), dissolved oxygen, temperature profiles, and nutrient concentrations. Monitoring approaches range from weekly or biweekly grab sampling to continuous real-time systems that provide daily or hourly data. Early detection depends on monitoring frequency and parameter selection. Continuous monitoring typically provides earlier warning than periodic grab sampling for rapidly-developing blooms.
What levels of microcystin are safe in drinking water?
EPA has established health advisory levels of 1.6 µg/L microcystin for adults and older children, and 0.3 µg/L for bottle-fed infants and young children under school age. These are advisory levels, not enforceable standards. However, many states have adopted them into monitoring and notification requirements. Utilities should maintain microcystin concentrations below these levels. They should implement enhanced monitoring when source water levels approach or exceed them.
How do you remove cyanotoxins from drinking water?
Cyanotoxins are contained inside healthy algae cells. They get released when cells die or are damaged. Prevention at the source avoids toxin release entirely. When toxins are present in water, removal or destruction methods include powdered activated carbon (effectiveness varies by toxin type), ozone or advanced oxidation processes (effective for many cyanotoxins, depending on dose and water chemistry), and, in some cases, granular activated carbon filtration. Conventional treatment removes intact cells but not dissolved toxins. This is why source water management that prevents bloom formation delivers better outcomes than relying solely on treatment plant responses.
What is the difference between algae, cyanobacteria, and harmful algal blooms?
Algae are diverse photosynthetic organisms, including green algae and diatoms, that grow in water. Cyanobacteria are photosynthetic bacteria historically called blue-green algae, though they are bacteria rather than true algae. Harmful algal blooms specifically refer to the rapid growth of algae or cyanobacteria that produce toxins, taste and odor compounds, or other conditions threatening water quality or public health. Not all algae or cyanobacteria cause harmful blooms. Many species grow without creating safety or operational concerns.
How do utilities manage harmful algal blooms?
Utilities manage blooms through layered strategies: monitoring for early warning, preventing bloom development at the source when possible, reducing long-term nutrient inputs through watershed management, and maintaining treatment plant response capabilities as backup. Effective management emphasizes prevention rather than reaction. Preventing bloom formation avoids toxin release, customer complaints, and operational disruptions entirely. Treatment plant responses address symptoms after blooms have already impacted operations. This makes them less efficient than source water prevention approaches.
Utilities facing recurring seasonal blooms, rising treatment costs, or increasing regulatory pressure often find that improving early detection and prevention delivers measurable operational and financial benefits. If you want to evaluate how your current monitoring and response strategy performs, our team can help assess your system and identify practical next steps based on your specific challenges and operational constraints.
Contact our team or explore our drinking water reservoir management resources.
Additional Resources:
Trusted by drinking water utilities, irrigation operators, and industrial water managers in 60+ countries
You’ve read the guide. Now apply it to your reservoir.
Every reservoir has a different bloom history, nutrient loading pattern, and operational constraint. Our water quality engineers review your specific site conditions, source water data, bloom seasonality, treatment setup, regulatory requirements, and design a monitoring and prevention programme built for your situation, not a generic template.
|
95%
ALGAE reduction
|
24/7
real-time monitoring
|
10K+
deployments worldwide
|